Context analysis
Baseline surveys
From 1995 to 1997 and from 2007 to 2008, RHS sites in England and Wales, Scotland and Northern Ireland (only for the 1995-7 surveys for the latter two countries) were selected using a stratified random sample design. The stratification of the sample was done to enable a good spatial coverage of the countries and meaningful comparisons between geographical areas and regions (Environment Agency, 2011). In 1995-1997, the basis for the sampling was the 250k scale river network and sites were selected using the Ordnance Survey (OS) 10km grid. Three RHS sites were selected randomly using a smaller 2km grid within each 10km square resulting in a total of 4555 sites. In 2007-8, the same process was repeated but only two sites were selected on the 250k network and one site was selected on river stretches from the 50k network outside the 250k network boundaries. The split in the sampling strategy was done so as to account for headwater streams which were under-represented in the previous sample. In 2007-8, sites from the Isle of Man and from small coastal areas were added to the survey. The 2007-8 survey therefore represents a combination of sampling strategies carried out at different scales and stratified per 10km squares. It resulted in a slightly larger sample sample of 4848 sites.
Method
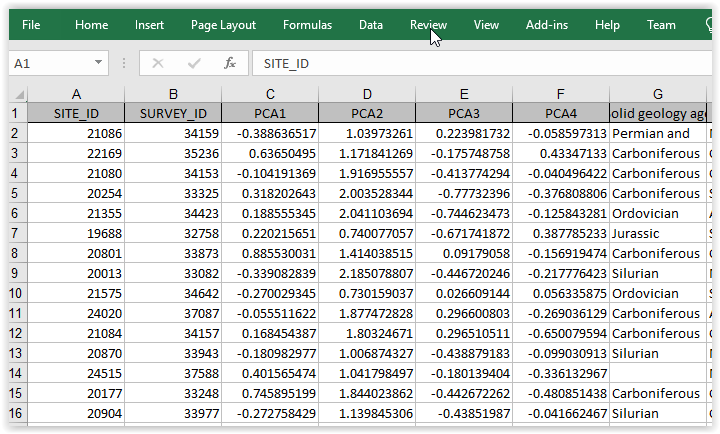
HQA scores are classified into five quality bands following a ‘context analysis’. A context analysis consists of comparing a site HQA to the distribution of HQA scores for sites of similar type selected from one of the baselines surveys using a nearest neighbour approach. The method, approved by the Environment Agency, combines map-derived attributes (altitude, slope, distance from source and altitude of source) into four indices representing known drivers of geomorphological change (i.e. specific stream power and shear stress; Jeffers, 1998) using Principal Component Analysis (PCA).
The indices, or PCA scores, are then used to select within a chosen baseline survey network the 150 sites that are closest in terms of the index values. A site is then assessed according to its position within the distribution of HQA scores for the 150 sites of similar type. The bottom quintile of the distribution represents very low habitat quality and the top quintile very high quality (all relative values).
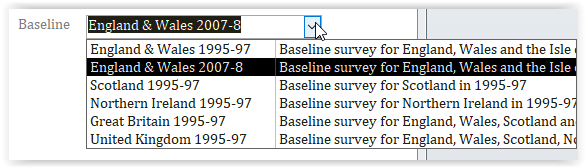
Depending on the location of your site, you may use different baseline reference networks to calculate HQA class. The context analysis module offers series of baseline survey. The Environment Agency uses the 1995-6 for its assessments. We would recommend using the more recent data.
This tool is only available when you edit a survey. Before you run the context analysis module, you need to have derived and entered the map data and calculated the PCA scores. Please note that you can now extract the required mapdata using an automated process and a database of already assessed points on the river network (see Extracting map data from nearby assessment points).
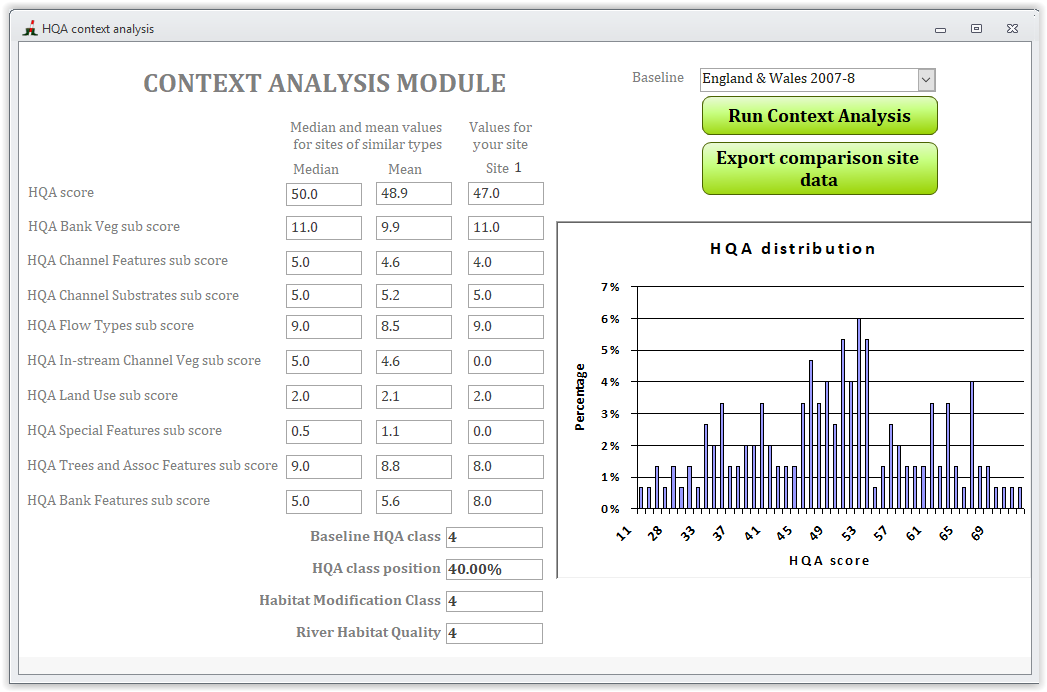
Once a reference network has been chosen, press the context analysis button and the software will derive the 150 sites of similar type and display the distribution of HQA scores on a chart as well as provide statistics about the HQA score and sub-scores. The HQA score percentile will be calculated and stored in the 'HQA class position' field, and the HQA class will be stored in the 'Baseline HQA class' field on the form and in the 'Indices' page. RHQ class and median values for all scores and sub-scores will be calculated, stored and displayed in the context analysis form (see below).
Exporting data
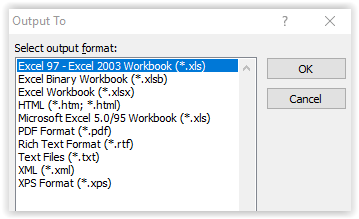
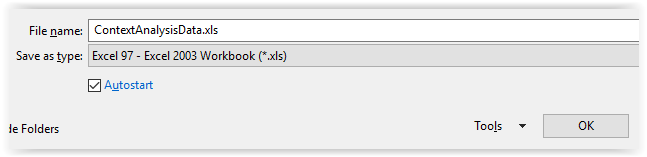
The sample of site for comparison data can be exported for further analyses (see below).
Important information!
Please note that every time you run this module, the data for HQA and RHQ scores are updated on the 'Indices' page.