NEW – RHS Toolbox 1.5 with RHAT WFD assessment and import from RAPID database

The RHS Toolbox 1.5 features new functionality to perform a RHAT assessment and to import data from the RAPID database.

The software is on a free trial for 30 days and it is available for 32 and 64 bit version of Office.

New features:

River Hydromorphology Assessment Technique (RHAT) scoring form

The River Hydromorphology Assessment Technique (RHAT) was developed in Northern Ireland by the Department of Environment to assess the hydromorphological condition of rivers for the Water Framework Directive (WFD). The field survey methodology was based on RHS and contains the same amount of information as a standard survey. The main differences are the width of spot-checks, which in RHAT are 50 m wide. The RHAT survey methodology also allows for partial surveys of the stream as the final scoring system does not rely on recorded data for its implementation.

The field assessment of morphological condition as part of RHAT is carried out in the field using expert opinion. Eight attributes representing bank and channel features and geomorphological functions are assessed on the scale of 0 (bad) to 4 (high) for their condition. Guidance on assessing condition is provided in the RHAT manual.

As the RHAT condition assessment is not calculated directly from survey data, it is possible to derive the score for a standard RHS. The RHAT condition assessment sheet was therefore added to the RHS toolbox as an additional option whilst doing surveys

RHAT assessment form in the RHS Toolbox

RAPID data import

RAPID is an application developed by the Centre for Ecology and Hydrology in the United Kingdom to input and process RHS data.

You can now import data from the RAPID database version 2 and 3 using the import button.

RAPID import menu in the RHS Toolbox

For more information about the software, you can go to the software page or read the manual online.

Instructions to download and install the RHS Toolbox:
1- Download the zip file for the relevant version of the RHS Toolbox: 

.
2- Create a RHS folder somewhere on your computer (e.g. C drive) and extract the content of the zip file into that folder.
3- If you do not have Access 2010 or later already installed on your PC, you can download and install the free Access 2016 runtime here
4- Double-click the file RHSDataInput.accdr.

The RHS Toolbox development requires investment in time and resources so it is unfortunately not possible to deliver it free of charge. You have access to a trial version for 30 days after which you will have to register and purchase a license. During the trial period, every time you log in, you will be asked whether you wish to purchase a license and register. Information on pricing can be found here

Potential issues: the RHS Toolbox was tested on UK (English) Windows Operating Systems. Due to different ways of representing decimal points, some of its functionality may not work on French and other Operating Systems that use commas (,) instead of points (.) to represent the decimal fraction of real numbers. Please let us know if you come across such problems.

Using River Habitat Survey in the Geography Curriculum at the University of Worcester

by Professor Ian Maddock, University of Worcester, January 2020

Third year undergraduate students at the University of Worcester can take an optional module in River Conservation and Management as part of their Geography or Physical Geography degrees. We offer a practical-based degree programme with a strong emphasis on fieldwork and in this module, the practical work is focused around the use of RHS. The first half of the module is largely classroom-based, focusing on new approaches to environmentally-sensitive river management, including river restoration, natural flood management and the application of environmental flows.  Guest speakers from the EA, wildlife trusts, rivers trusts, local authorities and environmental consultancies provide an overview of some of the organisations involved with these topics and give students insights into potential careers relevant to their interests.

copyright Ian Maddock

RHS provides the focus for the 2nd half of the module. Students are familiarised with the field survey methods and features that are assessed in the classroom and then get to trial the software in a PC room with dummy data sets. This allows them to get used to data input and score calculation and explore the impact of altering input fields and assessing the effect on the metrics calculated. They get a feel for what influences the Habitat Quality Assessment (HQA) and the Habitat Modification Score (HMS) and their sensitivity to data input.

This is followed by three weeks of fieldwork using RHS. The first one involves a ‘practice’ survey of a local stream and then straight back into the computer room for data input and metric calculations. Students work in small groups (2s and 3s) and all assess the same reach. Comparing scores between groups and identifying which features were scored differently between them enables a discussion on observer variability and the need for training to help standardise approaches and optimise data quality. In the following two weeks students assess two contrasting sites. One is a largely natural gravel-bed stream in a local nature reserve, with minimal direct human impact and high habitat quality. The second is a contrasting, heavily-modified urban stream dominated by channelisation including weirs, bank and bed reinforcements and channel realignment. For their assignment, students are required to produce a mock consultancy report and use the RHS outputs to 1) assess the current habitat quality and habitat modification, and 2) make recommendations for the implementation of suitable river restoration techniques. The important thing with the latter is they use the breakdown of the HQA and HMS metrics to underpin their recommendations, explicitly acknowledging the output of the RHS survey results to justify the techniques proposed.

RHS provides an ideal field technique for this type of work for many reasons. Students can become proficient in its use relatively quickly, survey times are sufficiently short to enable them to conduct a survey in a 3-4 hour timetable slot, it promotes a discussion about how to identify river habitat features, what features are deemed ecologically relevant and how the differing importance of features is acknowledged by the differential weighting of them towards the calculated metrics, and how habitats have been impacted in the past or can be restored. It also enables a more general discussion on the use of rapid visual assessment methods as a survey protocol compared to more detailed but time consuming quantitative techniques. We plan to trial the new mobile app this forthcoming year which should provide a more convenient way of recording data in the field and uploading it to the PC-based software.

Professor Ian Maddock

Professor of River Science

University of Worcester

River Habitat Survey App

RRC in collaboration with the University of Trás-os-Montes and Alto Douro, have been working to create a new, free application to record River Habitat Survey (RHS) sites in the field, using your smartphone. It works on Android phones and tablets, and the simple interface makes it easy to input data similar to how you would have originally completed the paper form. Just work your way through the sections on the App, filling in information at each Spot Check, recording the number of riffles, pools and bars, before carrying out the Sweep Up assessment of the overall reach. The user can also take photographs to be added to the survey, and the data can be exported to the RHS Toolbox and RAPID2 software.

Download the RHS Mobile Android App (3.3 MB) :

RHS App interface

RHS Natural Resources Wales analysis

Image result for nrw logoImage result for bournemouth universityImage result for river restoration centre

Natural Resources Wales, working with the River Restoration Centre and Bournemouth University, have recently published analysis of River Habitat Survey data from the repeat baseline survey in 2007-9 for six areas across Wales, allowing comparisons to be drawn in terms of levels of modifications and habitat quality. The analyses and indices from this report will be invaluable for Area Based Statements as well as providing evidence for our management and prioritisation of rivers. River restoration is a key priority for NRW and this report suggests a way forward for the assessment of restoration projects as well as modificaitions such as hydropower proposals.

Sue Hearn, Rivers Ecologist, Natural Resources Wales

View the report here

River Restoration Centre 19th Annual Network Conference 2018

Each year the River Restoration Centre (RRC) holds an Annual Network Conference that brings together professionals from all areas of river restoration including contractors, engineers, consultants, academics, and representatives from trusts, local organisations, and goverment agencies. The event is run over two days and includes around 50 speakers, workshop sessions and many other opportunities to network and make new contacts. Speakers present interesting, engaging presentations on their research or recent projects on current, hot topics.

For more information click here.

Books on rivers and river management

Rivers by Nigel Holmes and Paul Raven
Rivers_book_coverAn attractive new book by Nigel Holmes and Paul Raven should be a ‘must-read’ item for those with a professional, academic or general interest in rivers. Entitled simply ‘Rivers’ it is number 3 in the British Wildlife Collection series, and has 432 pages packed with more than 300 colour photographs, plus charts, graphs and other images. The sub-tilted theme is ‘a natural and not-so-natural history’ and the book describes how British rivers and associated plants, invertebrates, fish, birds and mammals have been changed by Nature and mankind since the last ice age.

It describes how and why these changes have occurred and explains how subtle variations in climate, geology and human history in different parts of Britain, have made each river unique. Three rivers, the Hampshire Meon, Welsh/Cheshire Dee and Endrick in Scotland are used to demonstrate how in more detail. The overall message is that understanding how rivers behave is crucial if they are to be properly managed and conserved for the benefit of people and wildlife into the future.
Copies can be ordered from British Wildlife Publishing (£30, free P&P within the UK) – details can be found here – and orders for signed copies taken by phoning 01865 811316.

Decision Support Systems: factors affecting their design and implementation within organisations. Lessons from two case studies by Marc Naura

DSS_book_Cover

How do we ensure that scientific tools, techniques and outputs (e.g. models, software, analytical techniques) are used in the ‘applied’ world’ of industry and government? In this research, we take the example of a group of software called Decision Support Systems (DSS) to discuss, with the help of literature reviews and 2 case studies, the factors affecting their implementation success within organisations. We particularly concentrate on the study of their interaction with organisational culture and the ‘frictions’ that assumptions taken in their design may generate with existing work practice and organisational beliefs. We further propose a methodology for developing models and tools that accounts for organisational and cultural factors, and demonstrate its application on a case study in a major public environmental organisation in the United Kingdom.

The book takes, as an example, the development of ToolHab, a Decision Support System for managing river habitats within the Environment Agency, England and Wales. ToolHab was originally designed for prioritising sites for habitat enhancement work for fish and it is now being tested for other purposes, such as the delivery of a environmental targets under the EU Water Framework Directive. The case studies illustrate the practical and cultural hurdles researchers, software designers and scientists face when attempting to develop methods, techniques and tools for practitioners and what can be done about it. The literature reviewed shows that these issues are by no means restricted to the environmental sector alone but are widespread across public and private industries whether in medicine, marketing or sales. Thus, the approach suggested will be relevant to many scientist, engineers and software developers involved in the production of tools and techniques across a wide spectrum of organisations (link to website).

Site selection strategies and tools for river surveys

by Naura, M. & Hornby D. D.

Choosing a sampling strategy

How do you choose survey sites for river characterisation?

In short, it all depends on your overall aims.

The sites chosen for the River Habitat Survey (RHS) baseline surveys in 1994-6 and 2007-8 were originally identified from Ordnance Survey1:50,000 Landranger maps using a stratified sampling strategy using a 10km grid. The aim was to get a representative picture of river habitats across England and Wales. The stratification was introduced to provide a sample that could also be used to characterise smaller geographical units such as river basins or catchments. Random sampling strategies without stratification may indeed produce clusters of sites in parts of the country and leave some areas unsampled. In the end, 3 RHS site locations were randomly selected within every 10km-square in England, Wales and Scotland.

Stratification can be performed according to a geographical area (e.g. squares or catchment boundaries), a river type or stream orders. It all depends on your specific reasons for introducing a stratum in your sample. If your aim is to compare the distribution of features across river types, you may want to stratify according to a set typology or stream orders. If your aim is to compare counties or states, then state or county boundaries may be used to stratify your sample.

You need to remember that you need to account for the effect of stratifying your sample when analysing the data. For example, a geographical stratification using squares (e.g RHS baseline surveys) may introduce a bias when analysing the overall sample as a whole as it gives more weight to squares with low stream densities. If, following survey, you find that 80% of your sites are heavily modified, it could be wrong to state that 80% of rivers in your geographical area are modified because unmodified streams in upland and headwaters squares will be under-represented compared to modified streams in lowland squares. You would need to correct your statistics using stream densities for each square.

There are other methods for sampling. One is to select sites at regular intervals (e.g. every 2km along the network from source to sea). Regular samples generate unbiased statistics as long as the chosen sampling interval does not correspond to the ‘wave length’ of the features you want to record. For example, the distribution of features such as riffles is a function of channel bankfull width. Now imagine that a specific habitat feature tend to occur every 2000m. Depending on your starting point, a 2km regular sampling strategies may completely miss the feature out. It is therefore important to make sure that the interval between survey sites does not correspond to the interval of occurrence of features you want to record.

Selecting your sites

When we put together the first RHS baseline survey in 1994, site selection was done by hand. This required quite a bit of work by a team of people who had to select every site using paper maps and random number tables (for more details click here). The method used for stratification itself introduced some bias. Indeed, sites were selected in every 10km-squares by further dividing them into 2km-squares. A 2km-square would then be chosen at random and the point on the river closest to the centre of the square would represent the midpoint of the RHS site. This selection method meant that large rivers were more likely to be selected than narrower ones potentially introducing a bias based on river width.

Geographical Information System (GIS) can help automate the identification of suitable river survey sites and reduce sampling bias. GIS can save significant time and money; reducing an intensive manual process which requires a team of people, to an individual pressing a button and obtaining a selection of sites within minutes!

GIS selection is not bias free though! I have seen algorithms implementing ‘random’ samples by randomly selecting polylines in a river network. Because polylines will be of different lengths, the sample obtained is likely to be biased towards small polylines (e.g. 1m) that will be over-represented in the network compared to longer ones (e.g. 10km).

To generate random samples for my research, I used RivEX which is an ArcGIS 10.1 AddIn that can automate the sampling of river networks. Provided you possess a valid network (a topologically correct centreline network), you can generate sampling locations using random or regular sampling strategies in RivEX.

With regular sampling you can generate points on the network:

● for each line of the network

● at a user specified stepping distance from network mouth

With random sampling you can generate points on the network:

● by sampling the whole network

● by stratifying the sampling with a user defined grid

● by stratifying the sampling with a user supplied polygon layer

Each sampling point generated is snapped to the river network and have attributes of ID, XY coordinates, intersecting polyline ID and in the case of supplying a polygon layer the polygon ID. The sampling points generated can form the basis for your catchment or river survey but you can also use them to:

● transfer metrics encoded into the network to the sampling points such as distance to network mouth or Strahler order;

● query other spatial layers (e.g. geology, land use or authority boundaries);

● generate catchment boundaries using an appropriate DEM;

● answer network tracing problems such as identifying the nearest site downstream or upstream.

The tool is scalable allowing you to generate sampling points at a national, regional or sub-catchment level. Figure 1 demonstrates stratified sampling using CCM data for Ireland. A 10Km grid is built and each cell sampled 3 times, the entire process took only 30 seconds!

Figure 1Figure 1. Stratified sampling of rivers in Ireland. RivEX was used to generate a 10Km grid and sampled each cell 3 times. CCM River and Catchment Database © European Commission – JRC, 2007.

With RivEX you can generate regularly spaced sampling points at a user specified distance from the network mouth. Figure 2 show the river Shannon in Ireland sampled every 10Km. Such a dataset would be vital for a walk over campaign allowing your field surveyors to survey the river at known coordinates. I personally used this very useful function to extract GIS data for typing rivers and implementing predictive models.

Figure2

Figure 2. Regular sampling of the main stem of the river Shannon, Ireland, with a stepping distance of 10Km. CCM River and Catchment Database © European Commission – JRC, 2007.

Conclusion

Defining a sampling strategy is a very important first step in any project aimed at characterising a river catchment or area. The choice of sampling strategy, method and intensity as well as the tool used are crucial and require careful consideration with regards to potential biases introduced. Tools exist that can help with automate the procedures and reduce bias.

For more information, read Jeffers, J. N. R. 1979 Sampling. Cambridge, Institute of Terrestrial Ecology, 7pp. (Statistical Checklist, 2). (Link to publication online)

European benchmarking: origins, purpose and outputs by Paul Raven

It was quite obvious early on in the development of RHS, and confirmed by results from the first baseline survey during 1994-97, that the UK had insufficient near-natural river channels to provide a reasonable calibration of habitat quality assessment. The ‘top quality’ benchmark sites surveyed in the UK simply didn’t do the job to cover the range of river types. So we looked to continental Europe, not only for near-natural examples, but also to see if RHS worked there. We also wanted to RHS on as wide a range of rivers as possible as part of development of the CEN guidance standard for assessing the hydromorphological character of rivers (Boon et al., 2010). It was colleagues on the CEN working group that provided the initial network of contacts.

The first phase involved comparison of different methods for assessing river morphology that were either already in use, or being developed across Europe. A very informative meeting to compare ideas and demonstrate techniques on the nearby river was held in Galloway, SW Scotland in 1998. It became apparent that even though the various methods all made use of similar river features and artificial modification categories, there was considerable variation in the ways these were recorded and how the information was used to evaluate channel form and habitat quality.

For RHS development, there were valuable lessons to be learnt by testing it across different bio-geographical regions, hydrological conditions and land-use patterns. From a UK perspective, the RHS method appeared to be sound, but if it was to be used elsewhere, specific testing would be needed and adaptations recommended in the light of experience. It was a great advantage that RHS was being used for the STAR project, involving several different European countries (Furse et al., 2006). Also, that a southern European version of RHS was being developed, specifically adapted for Mediterranean rivers (Buffagni & Kemp, 2002).

The second phase involved a specific comparison between RHS, the German LAWA method and the then French method SEQ. Rivers in France and the Pyrenees were surveyed by Patrick Charrier using all three methods. The work highlighted similarities and differences in approach, ease of use, analysis and conclusions. The conclusions and recommendations were discussed by the CEN workgroup in 2001 and published in 2002 (Raven et al., 2002).

The third phase involved the long overdue review and updating the 1997 RHS survey form. We took the opportunity to test it and testing it on rivers during our second visit to Finland, in June 2002, including streams inside the Arctic Circle. It was here that two mantras, relevant to all subsequent benchmarking surveys emerged: “always expect the unexpected”; and “never underestimate the importance of local knowledge”. We had encountered something unfamiliar to us in the UK; the forestry practice of removing boulders from the river channel so that felled tree trucks could be floated downstream to sawmills.

The 2002 Finland visit and further discussions with CEN working group colleagues triggered the fourth phase: a programme of benchmarking trips to various countries. So far these have covered eastern Poland (2003, 2007), Slovenia (2005), Southern Bavaria and Austria (2006), South-East France (2007), the Picos Mountains in Northern Spain (2008), Southern Portugal (2009), the Drawa River, Poland (2008, 2009) and the High Tatra mountains of Poland and Slovakia (2010). Each of these visits was written up in an illustrated report which contained summary results. Pdf versions of all these reports can be found on this website (click here). The results and broad conclusions were also published in Aquatic Conservation (Raven et al., 2010). The results from our most recent visit, to eastern Slovakia, are now being written up now. Each report has an Appendix with a series of recommendations for RHS generally and in particular for carrying out surveys on rivers in the study area

The benefits of these benchmarking surveys have been immense. We have established contact with those involved in similar work for the Water Framework Directive and river conservation right across Europe. We have had direct experience of carrying out surveys with host colleagues and being able to explain reasons for RHS and how it can be adapted and improved for use elsewhere. We have accumulated masses of new information about different rivers and how they have been affected by historical land-use change.

Through this website we will in due course be able to share RHS data on all our benchmark surveys, enabling users across Europe to see what was done, problems encountered and recommendations made. The recommendations be collated and a discussion group established to help improve survey technique and confidence in recognising unusual features in particular. We hope this leads to improved design and use of RHS and its integration with other survey work for river management and conservation purposes as well as well as academic research. This resource will consolidate progress made over the past 10-15 years and inspire others to take a broader outlook on river assessment.


References

Boon PJ, Holmes NTH, Raven PJ. 2010. Developing Standard Approaches for Recording and Assessing River Hydromorphology: The Role of the European Committee for Standardization (CEN). Aquatic Conservation:Marine and Freshwater Ecosystems 20: S55-S61.

Buffagni A, Kemp JL. 2002. Looking beyond the shores of the United Kingdom: addenda for the application of River Hbaitat Survey in South-European rivers. Journal of Limnology 61: 199-214.

FurseMT, Hering D, Brabec K, Buffagni A, Sandin L, Verdonschot PFM (eds.) 2006. The ecological status of European rivers: evaluation and intercalibration of assessment methods. Hydrobiologia 566: 1-555.

Raven PJ, Holmes NTH, Charrier P, Dawson FH, Naura M, Boon PJ. 2002. Towards a Harmonized Assessment of Rivers in Europe: a Qualitative Comparison of Three Survey Methods. Aquatic Conservation:Marine and Freshwater Ecosystems 12: 405-424.

Raven PJ, Holmes NTH, Vaughan IP, Dawson FH, Scarlett P. 2010. Benchmarking Habitat Quality: ObservationsUsingRiver habitat Survey on Near-Natural Streams and Rivers in Northern and Western Europe. Aquatic Conservation:Marine and Freshwater Ecosystems 20: S13-S30.

The origins and early history of RHS

by Paul Raven (April 2013)

In the beginning

Shortly after I was appointed as national conservation officer at the National Rivers Authority (NRA) in February 1991, one of my first tasks was to oversee publication of the field guidance manual for River Corridor Surveys (NRA, 1992). There was a lot of River Corridor Survey work going on at the time and its benefits for environmentally-sensitive flood defence works were plain to see, because engineers could design their schemes and carry out work using the annotated maps and recommendations produced by surveyors.

But, invaluable though this information was for local conservation staff and river engineers, there was no way of archiving, retrieving, analysing or presenting it in a way suitable for an objective evaluation of the physical state of rivers nationally. We needed to develop a method that could capture the same type of information, but in a more systematic and repeatable fashion and which could be used to establish a national dataset.

In 1992 a radically new approach to river management was being developed by the European Commission. The implications of the then ‘ecological water quality’ proto-Directive (an early precursor of the Water Framework Directive) were profound. Rather than just chemical and biological assessment of rivers, it required a fully ecological approach and by inference, a way of characterising the physical structure of rivers and assessing how this affected biological communities.

Preparing for this step-change in approach was going to mean something new. The NRA needed to develop a method and supporting database for consistently recording, storing and analysing river habitat data.

Ironically, in 1992 the Royal Society for Nature Conservation launched a campaign on rivers called RIVERWATCH. A very simple system for evaluating the chemical, biological and physical state of rivers was developed in conjunction with the NRA and material was distributed to all schools in Britain. A simple database was able to analyse data returns from hundreds of schools and the results were published. At that time the NRA could not provide an objective report on the national state of river habitats. This was an embarrassing shortcoming for the statutory body in charge of managing and reporting on rivers in England and Wales.

Early thoughts

Early thoughts on a national approach centred on using aerial photography to extract information for assessing the morphology of rivers. A feasibility study “River Corridor Strategic Overview” was commissioned and undertaken by the Institute of Freshwater Ecology (IFE) in 1992-3. At the time, remote-sensing imagery and digital data analysis were still in their infancy and data storage capacity was miniscule by today’s standards. The study concluded that it would be too expensive to commission a national aerial survey and to store and analyse the colour photograph images. An MSc project on the river Wyre confirmed that aerial photography could not be used alone for characterising river habitat structure and that ground surveys were needed to gain a full picture of habitats, pressures and impacts (Sansbury, 1994). Twenty years later (2013), the conclusion may not have been the same because of the incredible advances in technology.

So a field survey, based on those features recorded by river corridor surveys, informed by recent functional habitat work on rivers by David Harper at Leicester University was taken forward (Harper & Everard, 1998). A small team, advised by a project board that included external technical experts was formed to take forward and test a method.

An early show-stopper was the incredible variation of recognition and estimation between experienced river corridor surveyors. A seemingly simple task of estimating percentage cover of river-bed substrates or plants over 500m or even a 100m length of river gave surprisingly variable results which meant it was useless for repeat surveys or data analysis. Surveyors were being required to memorise and recall too much information on site. So percentage estimation was abandoned early on in favour of a more structured and sample-based approach.

The second big stumbling block was determining a unit sample length. Originally, it was assumed, quite reasonably, that a variable sample length based on multiples of channel width would be the best way. This was based on the knowledge that morphological features occur in broadly predictable sequences in natural rivers, determined by channel size. But the highly modified nature of streams and rivers across Britain and the major difficulty in determining bank top prevented this approach because there was no guarantee that two surveyors would agree on channel width and therefore sample length. Despite its own shortcomings, a standard unit length was required.

The key attributes for the new method were simplicity and practicality. Surveyors needed to be familiar with what they were observing and the results need to be replicable. Confidence in recording features was the over-riding criterion for quality assurance of the data. To maximise the chance of success we used river corridor surveyors and fish biologists who were familiar with the features recorded, asked them for ideas and these were then tested and revisions made to improve the method.

Prototype testing

A small project team was established in Warrington and Peter Fox led the technical work, which was commissioned and peer-reviewed by the project board. The board was packed with leading national experts on geomorphology, fisheries and conservation, river ecology and statistical methods. Professor Ron Edwards was a key figure for quality control, and being an NRA board member, provided the necessary link to fellow Directors.

Development work accelerated in 1993 and the prototype method was tested by surveyors on 172 sites. Peter Fox and Marc Naura designed and carried out exhaustive statistical testing to assess confidence in recording a long list of features and modifications and the variation between surveyors recording what they saw along the same stretch of river. From this, the survey protocol and form design emerged. A full account is given in Fox et al., 1998. The survey included the use of transects and a sweep-up summary and recording only predominant river-bed material, flow, bank and river-bed material. A unique set of abbreviations was developed and used as prompts on the survey form to improve confidence in recording. Sampling protocol was determined by cumulative data analysis derived from ‘transects’ every 10m along the upper, middle and lower reaches of the River Derwent in Cumbria. This river was chosen because it changed in character from source to sea and therefore gave a good variation in habitat and modification features. The Derwent work concluded that more than 80% of information could be captured by transects (subsequently called ‘spot-checks’) within 350m (Fox et al., 1998).

The project board had to make some pragmatic decisions that took account of statistical validity and ecological relevance as well as prototype testing results and existing river survey designs. Inevitably there had to be trade-offs. The first was sample length; given that River Corridor Surveys used 500m as a sample length and 350m was the minimum distance needed for the prototype RHS survey, it was agreed to adopt the 0.5km length on the basis that it was familiar and did not compromise data capture. The second was the number of transects within the 500m; it was considered that 10 equidistant ‘spot-checks’, supported by a ‘sweep-up’ summary to capture information was likely to be the most simple and effective frequency, which also allowed the target time of ca. one hour survey to be achieved. The third pragmatic decision was transect width; testing had revealed major variations between surveyors when percentage cover and a full suite of features was included, so a 1m width for physical features and a 10m wide transect for vegetation and bank-top land-use were adopted. Even within the 10m width there was still wide variation in estimating cover percentage, so another trade-off, and probably the most arbitrary, was the use of two categories: 1% as ‘present’ (P) and ≥ 33% (E) as ‘extensive’. For simplicity, these categories were also used for sweep-up attributes.

There was still a lot of testing and refinement to do and inevitably compromises and trade-offs had to be made as the survey protocol and form were re-designed. One key decision, which did not involve compromise, was the need to record the absence of features, as well as their presence. Absence is equally as important as presence for confidence in recording and data analyses.

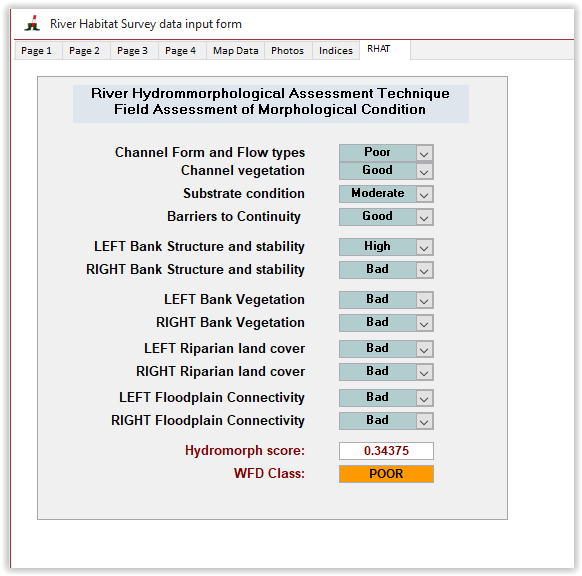
Another area of compromise was the development of the scoring systems-Habitat Quality Assessment (HQA) and Habitat Modification Score (HMS) (Raven et al., 1998). These protocols were derived by expert opinion and originally intended as an interim phase, to be replaced by more sophisticated data-derived scores using the RHS database. Regrettably, further development as intended was thwarted by lack of resources and time and unfortunately, both indices have become de facto headline outputs from the system, despite their shortcomings and dangers of application beyond their intended use. However, as part of a feasibility project on the development of River Habitat Objectives for English and Welsh rivers, HMS was improved and a new scoring system taking account of the extent and resilience of artificial structures was developed by Jim Walker and Kevin Hall (2004).

Establishing a national inventory

Another novel but necessary decision was to derive a national inventory of habitat features and channel modifications across the country, not by simply using existing River Corridor Survey maps, but by a statistically-designed sampling programme. All existing surveys and samples were subjectively selected: River Corridor Surveys were largely confined to those lowland rivers which already had, or were about to have, flood defence works; biological water quality samples were taken near bridges and most were located upstream and downstream from sewage treatment works and other point sources of pollution. We simply could not use these to derive an unbiased inventory or objective assessment. We also needed to be confident that the majority of features occurring right across Britain were included on the survey form prompt-list and properly described in guidance manuals and training courses.

No-one had ever attempted an objective inventory of rivers so this statistical sampling strategy was uncharted territory. A three-year programme (1994-96) of surveys was commissioned and surveyors trained. Sites were selected using a stratified random approach, with the 10km Ordnance Survey grid square acting as the stratifying layer. Three sites would be selected in each and surveyed. For 1994 the site was selected on the basis of ‘centred’ points in the 10km square. This was replaced in 1995 and 1996 by use of randomly-selected 1km squares within the 10km square as a more detailed stratified random framework.

For several reasons, the 1994 survey and resulting data were experimental. The survey was still a prototype and being tested; several definitions were not fully developed; and surveyors were not always confident. In response to the inevitable problems encountered, several amendments were made in time for the 1995 and 1996 survey seasons. These included agreement on ten standard flow-types derived from geomorphological research at NewcastleUniversity (Newson et al., 1998). Quality assurance included production of an illustrated guidance manual, training courses with an accreditation test, double-entry onto the database and logical checks for data validation. Surveyors who passed the test were given an accreditation code valid for 3 years.

Uptake and applications

The main rationale for RHS was to bring together geomorphological and ecological terminology and recording protocols. It required no more than a basic understanding of both disciplines, not detailed knowledge. Perhaps understandably, this novel hybrid approach met with considerable resistance from specialists from both camps; from river corridor surveyors used to mapping their observations on one side, and geomorphologists who considered that RHS didn’t provide enough information for their needs, on the other. Bridging the gap between the two disciplines took a surprisingly long time to close (see separate blog on linking morphology and ecology). Encouragingly, however, external technical colleagues were quicker to see the benefits of the approach than many internal NRA/EA staff. This external support and promotion of the approach and uses of RHS helped to break down internal barriers-eventually. Some staff didn’t really realise its intrinsic value until the Water Framework Directive suddenly opened their eyes to its purpose and application. In hindsight, much more effort was needed to explain the rationale and benefits internally, but we simply didn’t have the resources to run development, testing, deriving a national inventory and indices, securing a working database, training and collating examples of applications.

In the meantime, two more ground-breaking achievements were made. The first UK report on the state of river habitats was published in 1998, based on the 1994-96 baseline survey, plus additional surveys carried out on the Isle of Man. River Habitat Quality contained a foreword signed by the Environment Ministers from England, Wales, Scotland and Northern Ireland (Raven et al., 1998). It had taken 6 years from initial inception of the method to the first national report of its kind in the UK, indeed anywhere in the world. Second, Riverside Explorer, was launched in 2000 after two years of development. It was a slimmed down version of the RHS database with lessons and vocabulary tailor-made for geography pupils and teachers (Hawley et al., 2002). It is still being used today, having withstood the test of time.

It was important, in the light of requirements that assessment methods for the forthcoming Water Framework Directive had to be published after technical peer review, to consolidate the protocols. Equally important was demonstrating the use of RHS, again in scientific papers. The first collective peer review involving a wide range of academics, scientists and practitioners was at a meeting in London in 1998 and this resulted in a special issue of Aquatic Conservation later that year. Entitled ‘The Application of Classification and Assessment Methods to River Management in the UK’ (Boon & Raven, 1998) it contained several papers documenting the development and use of RHS as well as other river assessment methods. This also triggered the wider testing and application of RHS in mainland Europe.

Two other important applications were achieved. First, RHS was used as the standard morphological survey method as part of the STAR project which was inter-calibrating river methods across Europe for application in the Water Framework Directive (Furse et al., 2006; see separate blog on European work). Second, RHS data were an important source of information for SERCON (System for Evaluating Rivers for Conservation), developed, but regrettably never implemented, by the UK nature conservation agencies, under the auspices of Scottish Natural Heritage and the leadership of Phil Boon (Wilkinson et al., 1998).

Conclusions

RHS was a hybrid system, born out of necessity and evolved at the leading edge of convergence between geomorphological and ecological disciplines. Limited resources and technology that was often behind the necessary specification, plus the need to make pragmatic compromises in survey protocol and sampling strategy contributed to a far from perfect but still highly valuable end-product. This, novelty, and a lack of understanding about its use as a WFD tool, produced barriers to its uptake and use. Despite this, the approach, database, major outputs and uses have fully justified the early ‘growing pains’ and subsequent development. Making use of advanced technology and communications should allow its continued refinement, improvement and application a great deal easier.


References


Boon PJ, Raven PJ (eds). 1998. The Application of classification and assessment methods to river management in the UK. Aquatic Conservation, Marine and Freshwater Ecosystems. 8: 1-644.

Fox PJA, Naura M, Scarlett P. 1998. An account of the derivation and testing of a standard field method, River Habitat Survey. Aquatic Conservation, Marine and Freshwater Ecosystems. 8: 455-476.

FurseMT, Hering D, Brabec K, Buffagni A, Sandin L, Verdonschot PFM (eds.) 2006. The ecological status of European rivers: evaluation and intercalibration of assessment methods. Hydrobiologia 566: 1-555.

Harper DL, Everard ME. 1998. Why should the habitat-level approach underpin holisitc river survey and management ? Aquatic Conservation, Marine and Freshwater Ecosystems. 8: 395-414.

Hawley D, Raven PJ, Anstey KL, Crisp S, freeman, Cullis J. 2002. Riverside Explorer: an educational application of River Habitat Survey information. Aquatic Conservation, Marine and Freshwater Ecosystems. 12: 457-470.

National Rivers Authority. 1992.River Corridor Surveys: Methods and Procedures. Conservation Technical Handbook No. 1. NRA, Bristol.

Newson MD, Harper DM, Padmore CL, Kemp JL, Vogel B. 1998. A cost-effective approach for linking habitats, flow types and species requirements. Aquatic Conservation, Marine and Freshwater Ecosystems. 8: 431-446.

Raven PJ, Holmes NTH, Dawson FH, Everard ME. 1998. Quality assessment using River Habitat Survey data. Aquatic Conservation, Marine and Freshwater Ecosystems. 8: 477-500.

Raven PJ, Holmes NTH, Dawson FH, Fox PJA, Everard M, Fozzard, IR, Rouen KJ. 1998.River Habitat Quality: the physical character of rivers and streams in the UK and Isle of Man. Environment Agency, Bristol.

Sansbury, 1994. Survey of the the river Wyre catchment Lancashire testing the River Habitat Survey methodology. September 1994, Master Thesis, LancasterUniversity.

Walker and Hall, 2005, River Habitat Objectives project report. Environment Agency.

Wilkinson J, Martin J, Boon PJ, Holmes NTH. 1998. Convergence of field survey protocols for SERCON (System for Evaluating Rivers for Conservation) and RHS (River Habitat Survey). Aquatic Conservation, Marine and Freshwater Ecosystems. 8: 579-596.