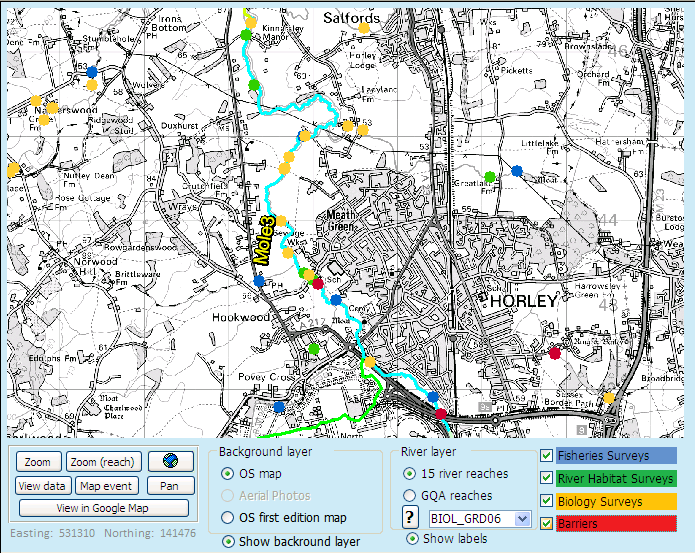
The map view
You can use the map view to display various data layers available in ToolHab. Three background layers are available: a black and white version of the 50,000 scale OS map, Environment Agency aerial photographs and the 1900s first edition OS maps. Not all first edition maps and aerial photographs have been loaded on the Decision Support System because of issues of speed and data storage.
There are series of buttons and function to help view and navigate through the map layers.
Use the  button to zoom in and out using a left click for zooming in and a right click for zooming out. You can also use the wheel of your mouse to perform both functions.
Use the  button to automatically zoom to the selected reach (e.g. Mole3 reach).
Use the  button to automatically zoom to the map full extent.
Use the  button to navigate through the map by click-holding an area of the map and dragging it in one of the cardinal directions.
Use the  button and click on any point of the map to open google map and display an aerial photographs of the selected area.
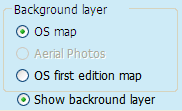
Several background layers can be displayed: OS maps, aerial photos and OS first edition maps. The OS map resolution will vary according to zoom levels. At very large scale, no map will be displayed. As you zoom in further, different resolution maps will gradually appear (1:250k; 1:50k). The maximum resolution is the OS 1:50,000 scale map.
The aerial photograph and OS first edition map layers will only be displayed at low scale. At large scale, the 2 option will be greyed out and unavailable. You will first need to zoom in to enable the option and display the maps.
You can turn the background layer on and off by clicking the 'Show background layer' button.
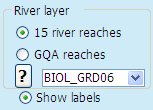
Two river layers are available: the river reaches defined as part of this research project and the General Quality Assessment (GQA) reaches. The GQA reach layer contains various water quality and biological quality index values that can be displayed as a thematic map using the following drop-down box  . If you want to learn more about GQA, go to Appendix 1. To see the legend of the map, click on the
  button.
Labels for the river layers will be displayed dynamically according to scale. They will disappear at small and large scales. To turn the labels on and off, press on the 'Show labels' radio button.
You can also view four point layers corresponding to major surveys carried out by the Environment Agency (Fisheries, Biology and RHS) and also to the location of physical barriers to migration (weirs and dams). Data for the whole country river network have been added to the database however, at large scale, only data points related to the 15 rivers for which river reaches have been derived will be displayed. To view the remaining points, you will need to zoom in further and they will appear (see below extra sampling points and tributaries of the river Mole).
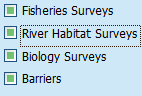
Click on any of the check boxes associated with the river surveys to display them on the map.
![]() Beware that when you are using the map view, you may be moving from one reach to another on the map but the data displayed on the reach info will not change and will display information for the reach highlighted in the reach drop-down box at the top right hand side of the window (the default is the Mole3 reach).
Beware that when you are using the map view, you may be moving from one reach to another on the map but the data displayed on the reach info will not change and will display information for the reach highlighted in the reach drop-down box at the top right hand side of the window (the default is the Mole3 reach).