Viewing survey data:
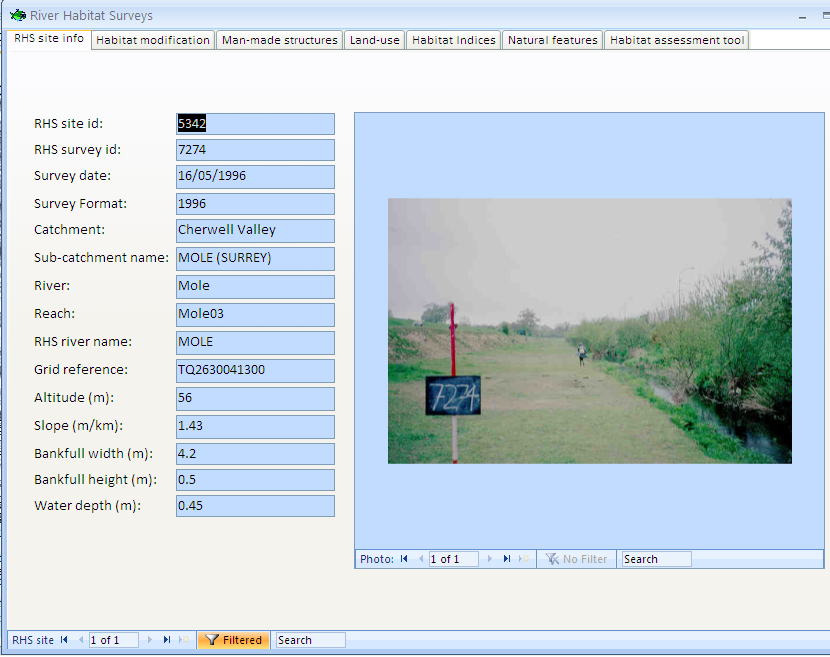
The River Habitat Survey data form
First, use the  button to zoom to the sites of interest. Then select one or more of RHS sites using the
  tool. The following form will open (see below). The number of sites selected and displayed is indicated at the bottom left of the form. The RHS form has got 7 tabs. The first tab displays general information about the RHS site, its location, altitude whilst the other tabs provide information on habitat features, modifications, land use and habitat suitability for trout. RHS data have been summarised into indices or graphs/charts to facilitate viewing and data analysis.
More than one RHS site can be selected and displayed. To navigate between sites, use the navigation panel  at the bottom of the window.