Habitat assessment tool
The habitat assessment tool is based on combined RHS, water quality and land use data. It uses conceptual models derived by experts (see 'knowledge resources') and turns them into predictive models using available data.
Expert fisheries officers from the Environment Agency were gathered to build simple conceptual models of fish habitat for 3 life stages (spawning, juveniles and adults). The models were combined and tested on existing fish and habitat data on a total of 2500 sites. The resulting models were then applied to all existing RHS sites and are presented in ToolHab in a graphical way for three species: Trout, Pike and Dace (more species will be added in the future).
The factors affecting each species habitat can be split into 2 broad groups:
- Natural habitat features;
- Pressures and impacts.
On the figure below, all pressures and natural habitat feature have been grouped into 2 columns.
The figure is 'read' from left to right using colour-coded boxes and lines.
The potential impact of each pressure is indicated using the colour of its box. The colour code is as follow:
- Blue: the pressure may not be present or if it is, it has little or no impact on fish density.
- Yellow: the observed pressure level has a fair amount of impact on fish density
- Orange: the observed pressure level has high impact on fish density
- Red: the observed pressure level has very high impact on fish density.
The suitability of each habitat feature is assessed using the colour of its box. The colour code is as follow:
- Blue: very high
- Green: high
- Yellow: fair
- Orange: poor
- Red: very poor or feature absent.
The coloured lined represent the impact of habitat features and pressures on each other and on fish.
The colour of the lines indicates the nature of the impact:
- blue is for positive impact (e.g. coarse substrate impacts positively on the presence of unbroken waves);
- orange is for negative impact (e.g. tilled land-use will impact negatively on substrate coarseness - by increasing the amount of fine sediment present).
The thickness of the line represents the level of observed impact from low (thin line) to high (thick line)
Sometimes a pressure can be a positive driver to species distribution. For example, high levels of nutrient enrichment may be detrimental to salmonid species but favour the presence of more pollution tolerant species such as roach or pike. When a pressure is positively associated with the occurrence of a species, it will be displayed in shades of grey (according to its overall level of occurrence) in between the 2 columns representing pressures and natural habitats to highlight its ambivalent role.
When a pressure box colour is cyan and there are no arrows linking it to other boxes, it means that the pressure is absent. When a pressure box is greyed out, it indicates missing data.
Example:
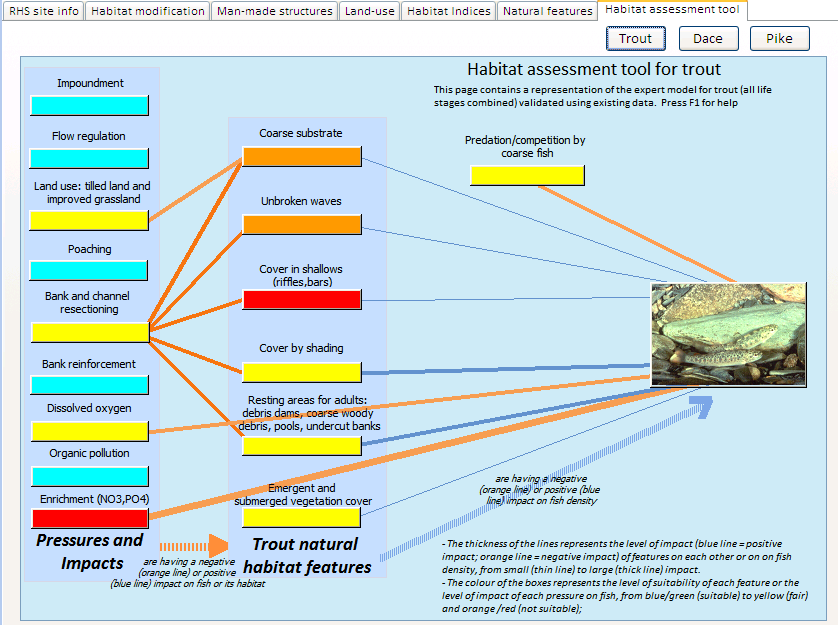
Above and below is an example of model outputs for a site that, according to the Fisheries Classification Scheme model predictions and monitoring data available in ToolHab, should have high trout density but is mainly dominated by coarse fish such as pike and dace whose probability of occurrence in a natural state is much lower.
Trout model
The model outputs and RHS data suggest that the site habitats are altogether not favourable to trout. Natural habitat features normally associated with trout are missing or poorly represented (coarse substrate, unbroken standing waves, cover in shallows). Other features such as shading, resting areas for adults and channel vegetation structure are moderately suitable to trout. The site also displayed fairly high levels of bed reinforcement.
The model highlights 3 groups of pressures potentially having an impact on trout habitats and fish density: bank and channel resectioning, land use and water quality (dissolved oxygen and enrichment).
Bank and channel resectioning potentially is the highest source of impact because of its effect on substrate, flow patterns (unbroken waves), the presence of cover in riffles and bars, the presence of shading and resting areas for adults. Bank and channel resectioning requires the use of heavy machinery along with the removal of trees (for access) to create a larger, deeper cross section. This results in slower flows, the deposition of fine sediment in the centre of the channel and on the margins where slow flows also promote the growth of emergent macrophytes. Marginal habitats features such as bars and undercut banks are generally removed and recovery is slow. Tilled land use is also a source of fine sediment that may affect sediment coarseness and the availability of clean gravel for spawning.
Water quality elements are the second highest potential source of impact on trout density. Dissolved oxygen and BOD levels were fair but enrichment levels were high. Nearby biological and chemical sampling sites and the GQA map showed fair levels of organic pollution but high phosphate inputs potentially having high impact on trout occurrence.
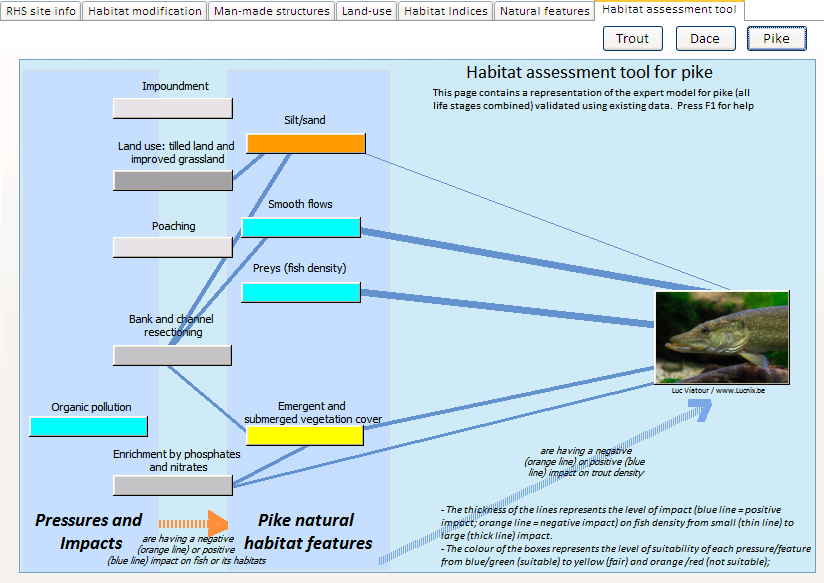
Pike model
The model below suggest that the habitat for pike is altogether suitable. Although it lacks the quantity of fine substrate pike requires, it displays smooth flows, suitable levels of marginal habitats and plenty of prey (roach, dace, minnows etc.). The model suggest that anthropogenic alterations or 'pressures' such as impoundment, land use and resectioning could be beneficial to pike habitat as they create the slow flowing conditions and marginal habitats that are favourable to pike.
Pike are very resistant to pollution and anthropogenic impacts such as resectioning. In fact, only high levels of organic pollution seem to affect their distribution and they seem to favour rivers with moderate levels of enrichment. Most other types of modifications seem to have potential positive impact on pike habitats. Resectioning, tilled land use and poaching promote the input of fine sediments, smooth flows and marginal vegetation that pike favour.
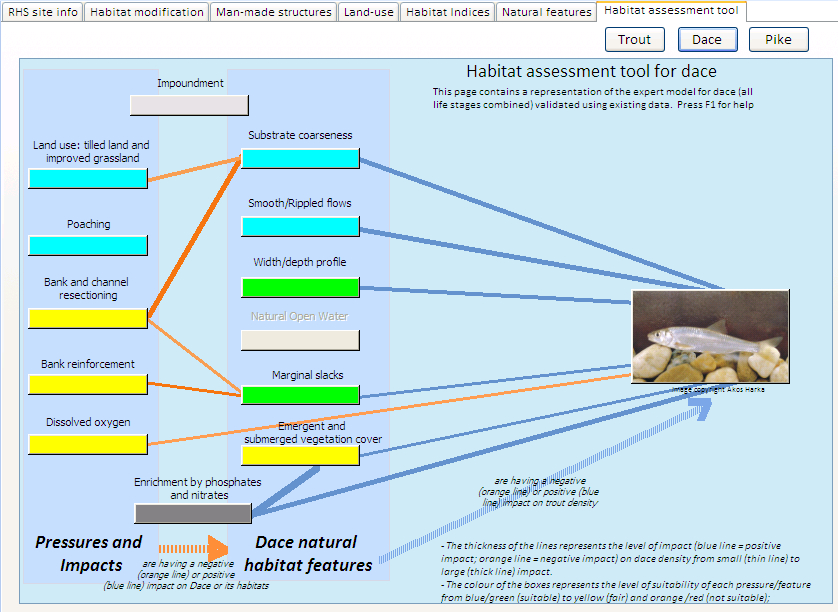
Dace model
The model for dace indicates that the site displays good levels of habitat suitability for dace. Most natural habitat feature indicators show high levels of suitability and pressures such as bank and channel resectioning and dissolved oxygen are at tolerable ('fair') levels and do not seem to affect negatively dace habitat structure. Dace tend to favour habitat with moderate levels of enrichment. Enrichment on site could have a positive impact on dace occurrence. Bank and channel resectioning does not seem to affect dace as much as trout. This is potentially due to the fact that although dace requires coarse substrate to reproduce, it is more tolerant to fine sediment inputs and it does not require fast flowing features such as trout. On the contrary, dace tends to be associated with sites dominated by deeper mesohabitats such as runs and glides and structures or modifications such as weirs and resectioning increasing depth may be beneficial to them.
In summary, we see here how the fish conceptual and predictive models can be used in combination with fish, chemistry, RHS and other data to diagnose potential pressures and impacts on species habitats.
The fisheries predictive models indicated a lack of trout and a potential higher than expected dace and pike population. The conceptual expert models suggested that channel resectioning, land use and water quality may explain the absence of habitat features naturally associated with trout and the occurrence of features associated with pike and dace.
Used in combinations, the models, data and tools enable us to identify potential pressures and impacts and establish a diagnostic before setting management action.