Reach statistics:
Biological indices
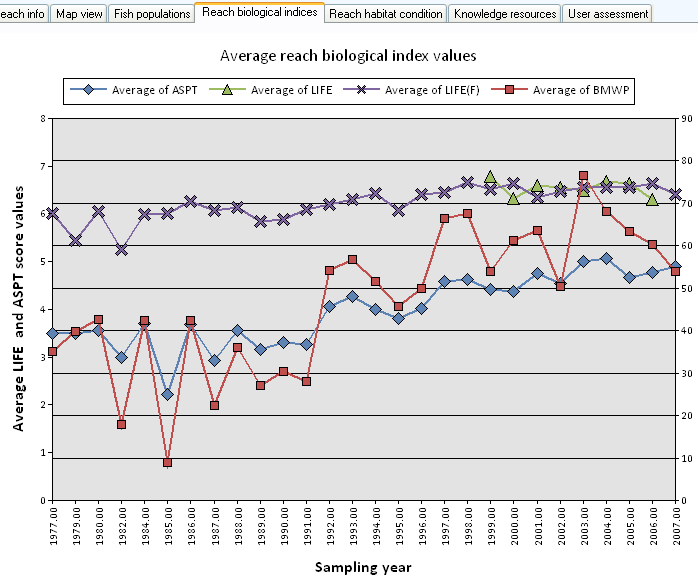
A biology index chart is drawn from all the GQA sampling points within the selected reach. The form shows the change in four index values along time: the Average Score Per Taxon, the BMWP, and two LIFE indices.
If you want to learn more about the meaning and significance of biological indices, go to Appendix 2.