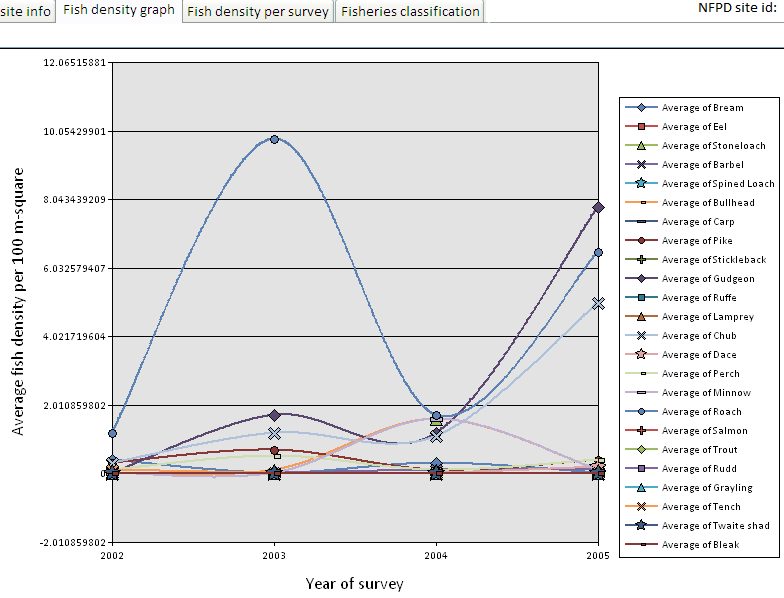
Fish density graph
The second tab displays a graph of fish density change along time. Each of the 23 species recorded during survey displayed using symbols joined by a line. To identify specific points lines, just hover with the mouse over the point/line.