Fish density graph
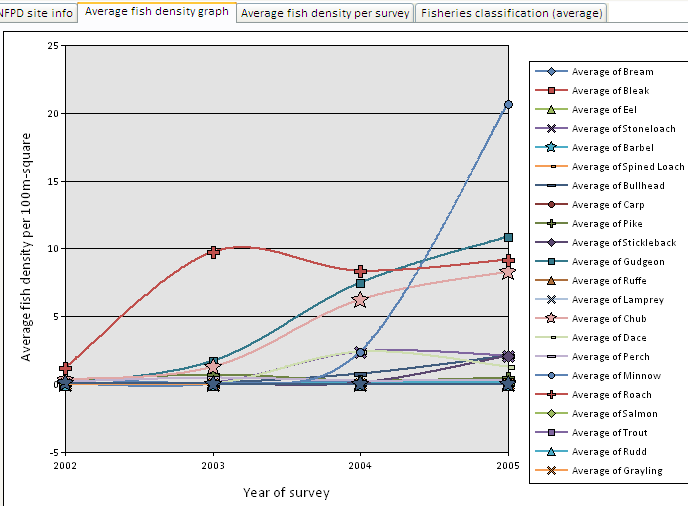
The second tab displays a graph of average fish density change along time for all the NFPD sites in the reach (2 sites for the Mole3 reach). Each of the 23 species recorded during survey displayed using symbols joined by a line. To identify specific points lines, just hover with the mouse over the point/line.