Fisheries classification
Finally, the last tab contains information taken from the Fisheries Classification Scheme (FCS2). FCS2 predicts, for most fisheries survey sites 3 indices:
- an overall Environmental Quality Ratio (EQR) score for the reach. Values close to 1 indicate closeness to reference condition;
- an EQR class from high to poor;
- the expected number of species caught at reference condition;
- the likelihood of catching each species at reference condition;
- the likelihood of catching more fish than at the surveyed reach at reference condition;
The predictions and the actual number of fish caught are displayed as bar charts. The figures displayed are averages for all NFPD sites on the selected reach.
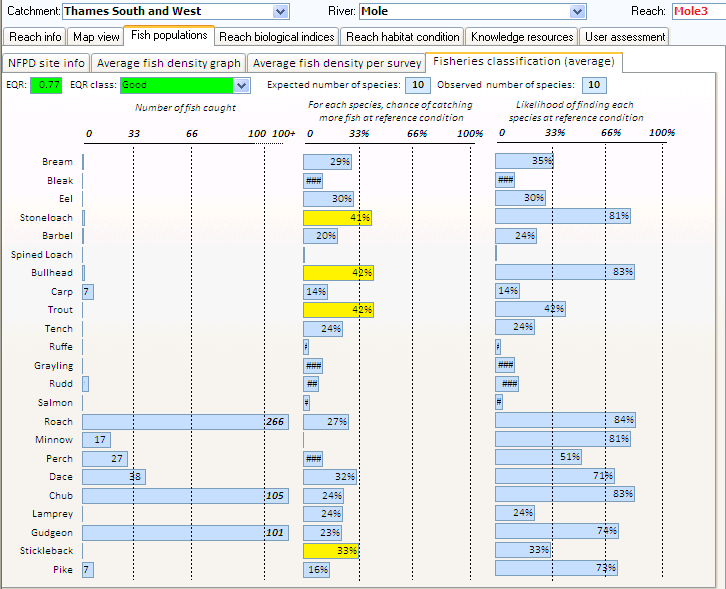
In the example below, the average expected number of fish caught at reference condition exactly matches the number of species caught at the last survey. The overall EQR is close to one and the EQR class is 'Good'.
All fish species that have a high probability of being caught at reference conditions (see red bars on the right-hand chart) were caught during electro-fishing (left-hand side chart) most of the time in numbers greater than predicted by FCS2 (middle chart). For example, roach were found in high numbers (266 individuals in average) and according to FCS2 predictions, there is a 84% chance of finding roach on the reach at reference conditions and a 27% chance of finding more fish than observed (in average). The reach therefore has higher densities of roach than can be expected at reference condition.