Viewing survey data:
The biology data form
First, use the  button to zoom to the sites of interest. Then select one or more of biological sampling sites using the
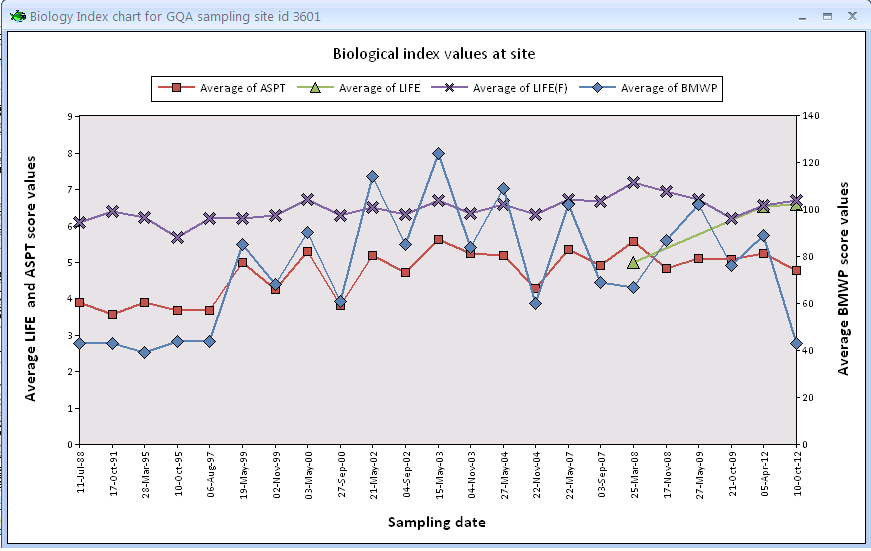
  tool. The following form will open (see below). A biology index chart is drawn from all the GQA sampling points selected using the selection tool. The form shows the change in four index values along time: the Average Score Per Taxon, the BMWP, and two LIFE indices.
If you want to learn more about the meaning and significance of biological indices, go to Appendix 2.
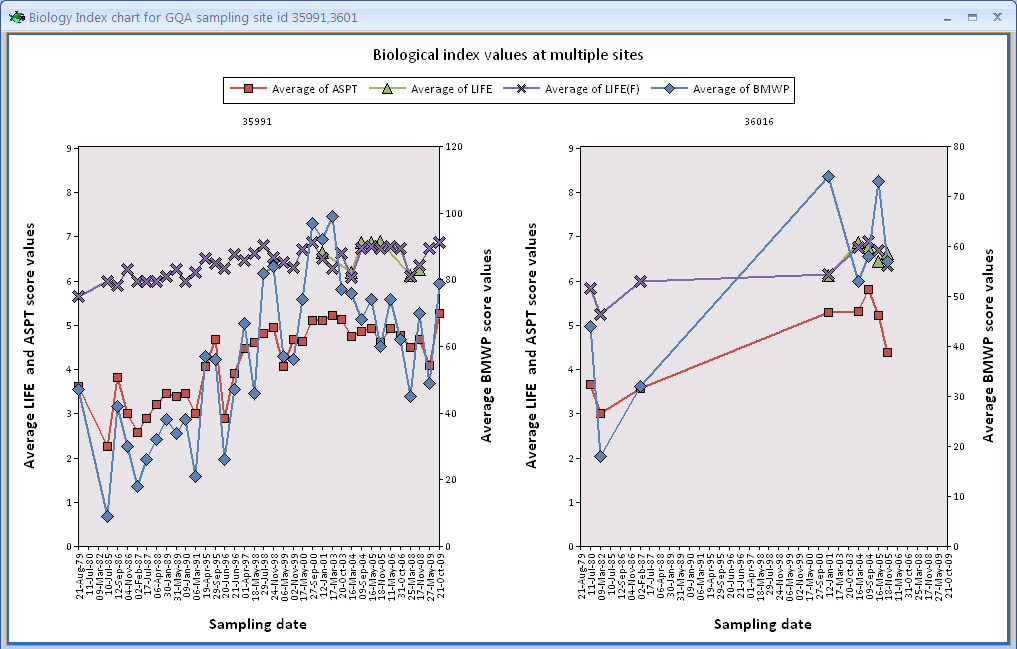
You can select up to 4 sites in one go. The data and time series for all selected sites will be displayed into a single panel. An example is given below for data extracted from 2 biological sampling points.