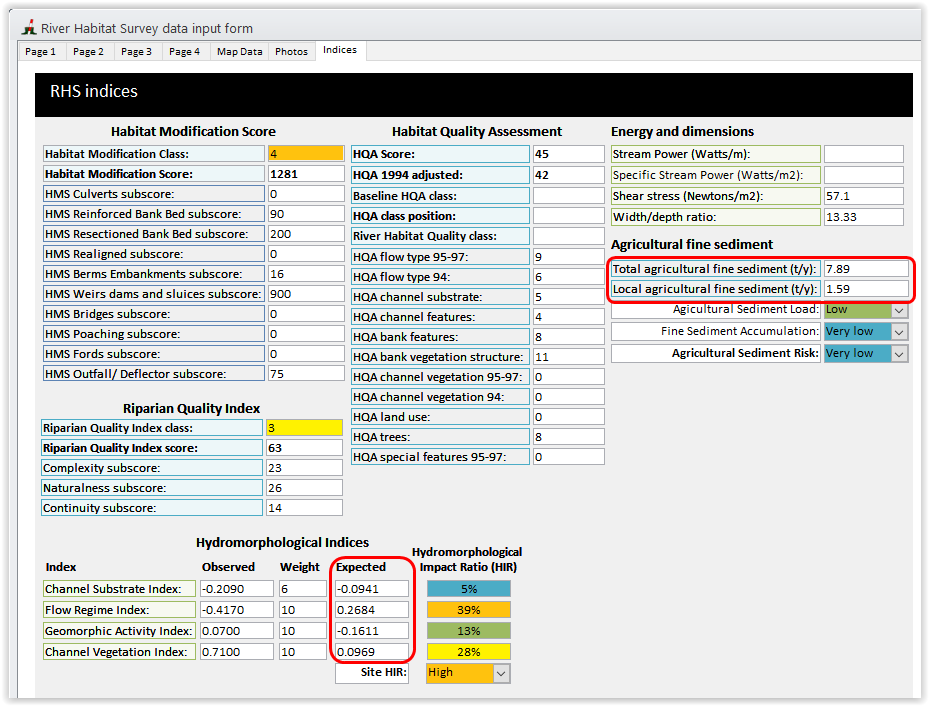
Indices
This page displays calculated scores and indices for:
- To calculate the Habitat Modification Score (HMS) indices, press  .
.
- To calculate the Habitat Quality Assessment (HQA) indices, press 
- To calculate all other indices, press 
Quality indices (HQA, the River Habitat Quality index and the Riparian Quality Index) are classified into 5 classes that are represented using a number between 1 and 5 and the following colour code (see also the table below and the appendices for more detail):
Pressure and impact indices (HMS, the three agricultural fine sediment indices and the Hydromorphological Impact Ratios) are classified into 5 classes that are represented using a number between 1 and 5, a percentage or a description associated to the following colour code (see also the table below and the appendices for more detail):
To preserve the integrity of the data, all scores based on RHS data are not directly editable.
The following scores and attributes (circled in red in the figure below) that can be derived by hand and that do not rely on RHS data can me modified by users:
Please note that, provided that the relevant information is included to calculate the indices, the HIR, the Agricultural Sediment Load and Agricultural Sediment Risk indices may be recalculated after changing any of the fields mentioned above.
Description of RHS indices
Details about the indices mentioned below can also be found in the appendices and on the RHS website: http://www.riverhabitatsurvey.org/manual/rhs-indices/
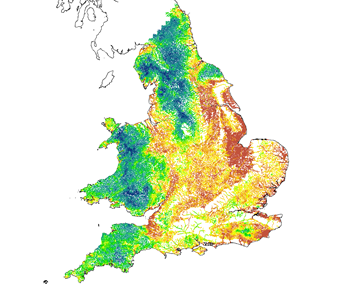
Map of CSI using geostatistical techniques at every 500m across the 1/50,000 river network on a gradient from bedrock/boulder (blue) to gravel-pebble (green) and silt-sand-clay (brown).
RHS index |
Range |
Description |
|
Habitat quality indices |
Habitat Modification Score (HMS) |
0 to 6000+ |
Quantifies the extent, potential impact and persistence of engineering structures |
HMS class |
1 (semi-natural) to 5 (severely modified) |
Classification of HMS score into 5 categories using set boundaries |
|
Habitat Quality Assessment score (HQA) |
0 to 100 |
Quantifies the diversity and naturalness of habitat features |
|
HQA class |
1 (very low) to 5 (very high) |
Classification of HQA score by comparing to sites of similar types using a context analysis. |
|
River Habitat Quality (RHQ) index |
I (excellent) to V (very poor) |
Classification combining HMS and HQA classes and representing overall habitat quality and conservation value |
|
Riparian Quality Index (RQI) |
1 (very low) to 5 (very high) |
Quantifies the complexity, continuity and naturalness of the riparian vegetation |
|
Hydromorphological indices |
Channel Substrate Index (CSI) |
-2 (silt) to 1 (boulders) |
Represents the average substrate size |
Flow Regime Index (FRI) |
-1 (glide) to 2 (waterfall) |
Represents the average flow-type |
|
Channel Vegetation Index (CVI) |
-2 (free floating vegetation) to 1 (mosses and lichens) |
Represents the dominant vegetation types |
|
Geomorphic Activity Index (GAI) |
-1 (no activity sign) to 1.6 (high activity) |
Represents the level of geomorphic activity (i.e. erosion and deposition) |
|
Hydromorphological Impact Ratio (HIR) |
1 (low impact) to 5 (very high impact) |
Quantifies the level of departure from natural state of CSI, FRI, CVI and GAI combined |
|
Channel Resectioning Index (CRI) |
0 (no resectioning) to 30 (all resectioned) |
Quantifies the occurrence of bank and channel modification by resectioning (i.e. dredging of the bed and reprofiling of the banks) along the channels |
For information on the calculation of indices, please refer to the River Habitat Survey website resource section: http://www.riverhabitatsurvey.org/manual/rhs-indices/
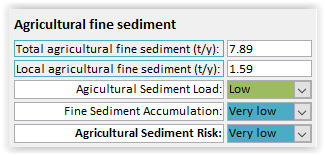
Agricultural Fine sediment indices
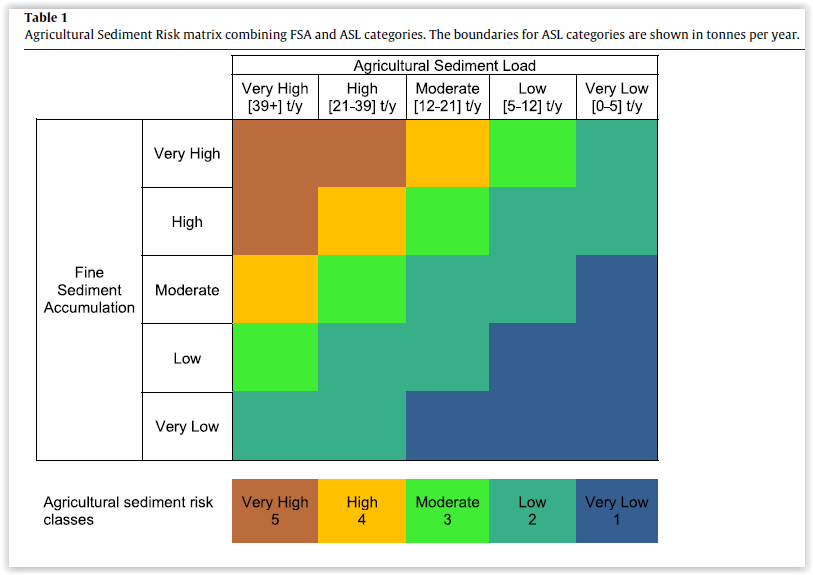
Provided your site is located in Great Britain, the software will extract information on agricultural fine sediment delivery to your site in tonnes per year and derive a series of indices representing Agricultural Sediment Load (ASL), Fine Sediment Accumulation (FSA) and overall Agricultural Sediment Risk (ASR). These indices were derived as part of research for the UK government and published in 2016 (Naura et al 2016).
Total agricultural fine sediment delivery represent all fine sediments transported from upstream in the water column and local sediment delivery (on site) through run-off and tributary inputs. The data are derived using modelling but can be entered by hand by the user.
Local agricultural fine sediment delivery represent all fine sediments delivered through run-off and tributary inputs.
The Fine Sediment Accumulation index is derived directly from your RHS site spot-check data for channel substrate. Sites will be categorised according to the number of spot-checks with silt, sand or clay as:
The ASR combines the FSA and ASL using a matrix