By Kostas Stefanidis (1)
Historically, Greece lacked a unified, integrated approach for assessing the hydromorphological quality of its rivers. This gap became particularly evident when the European Union’s Water Framework Directive (WFD) required member states to monitor the hydromorphological status of all surface freshwater bodies systematically.
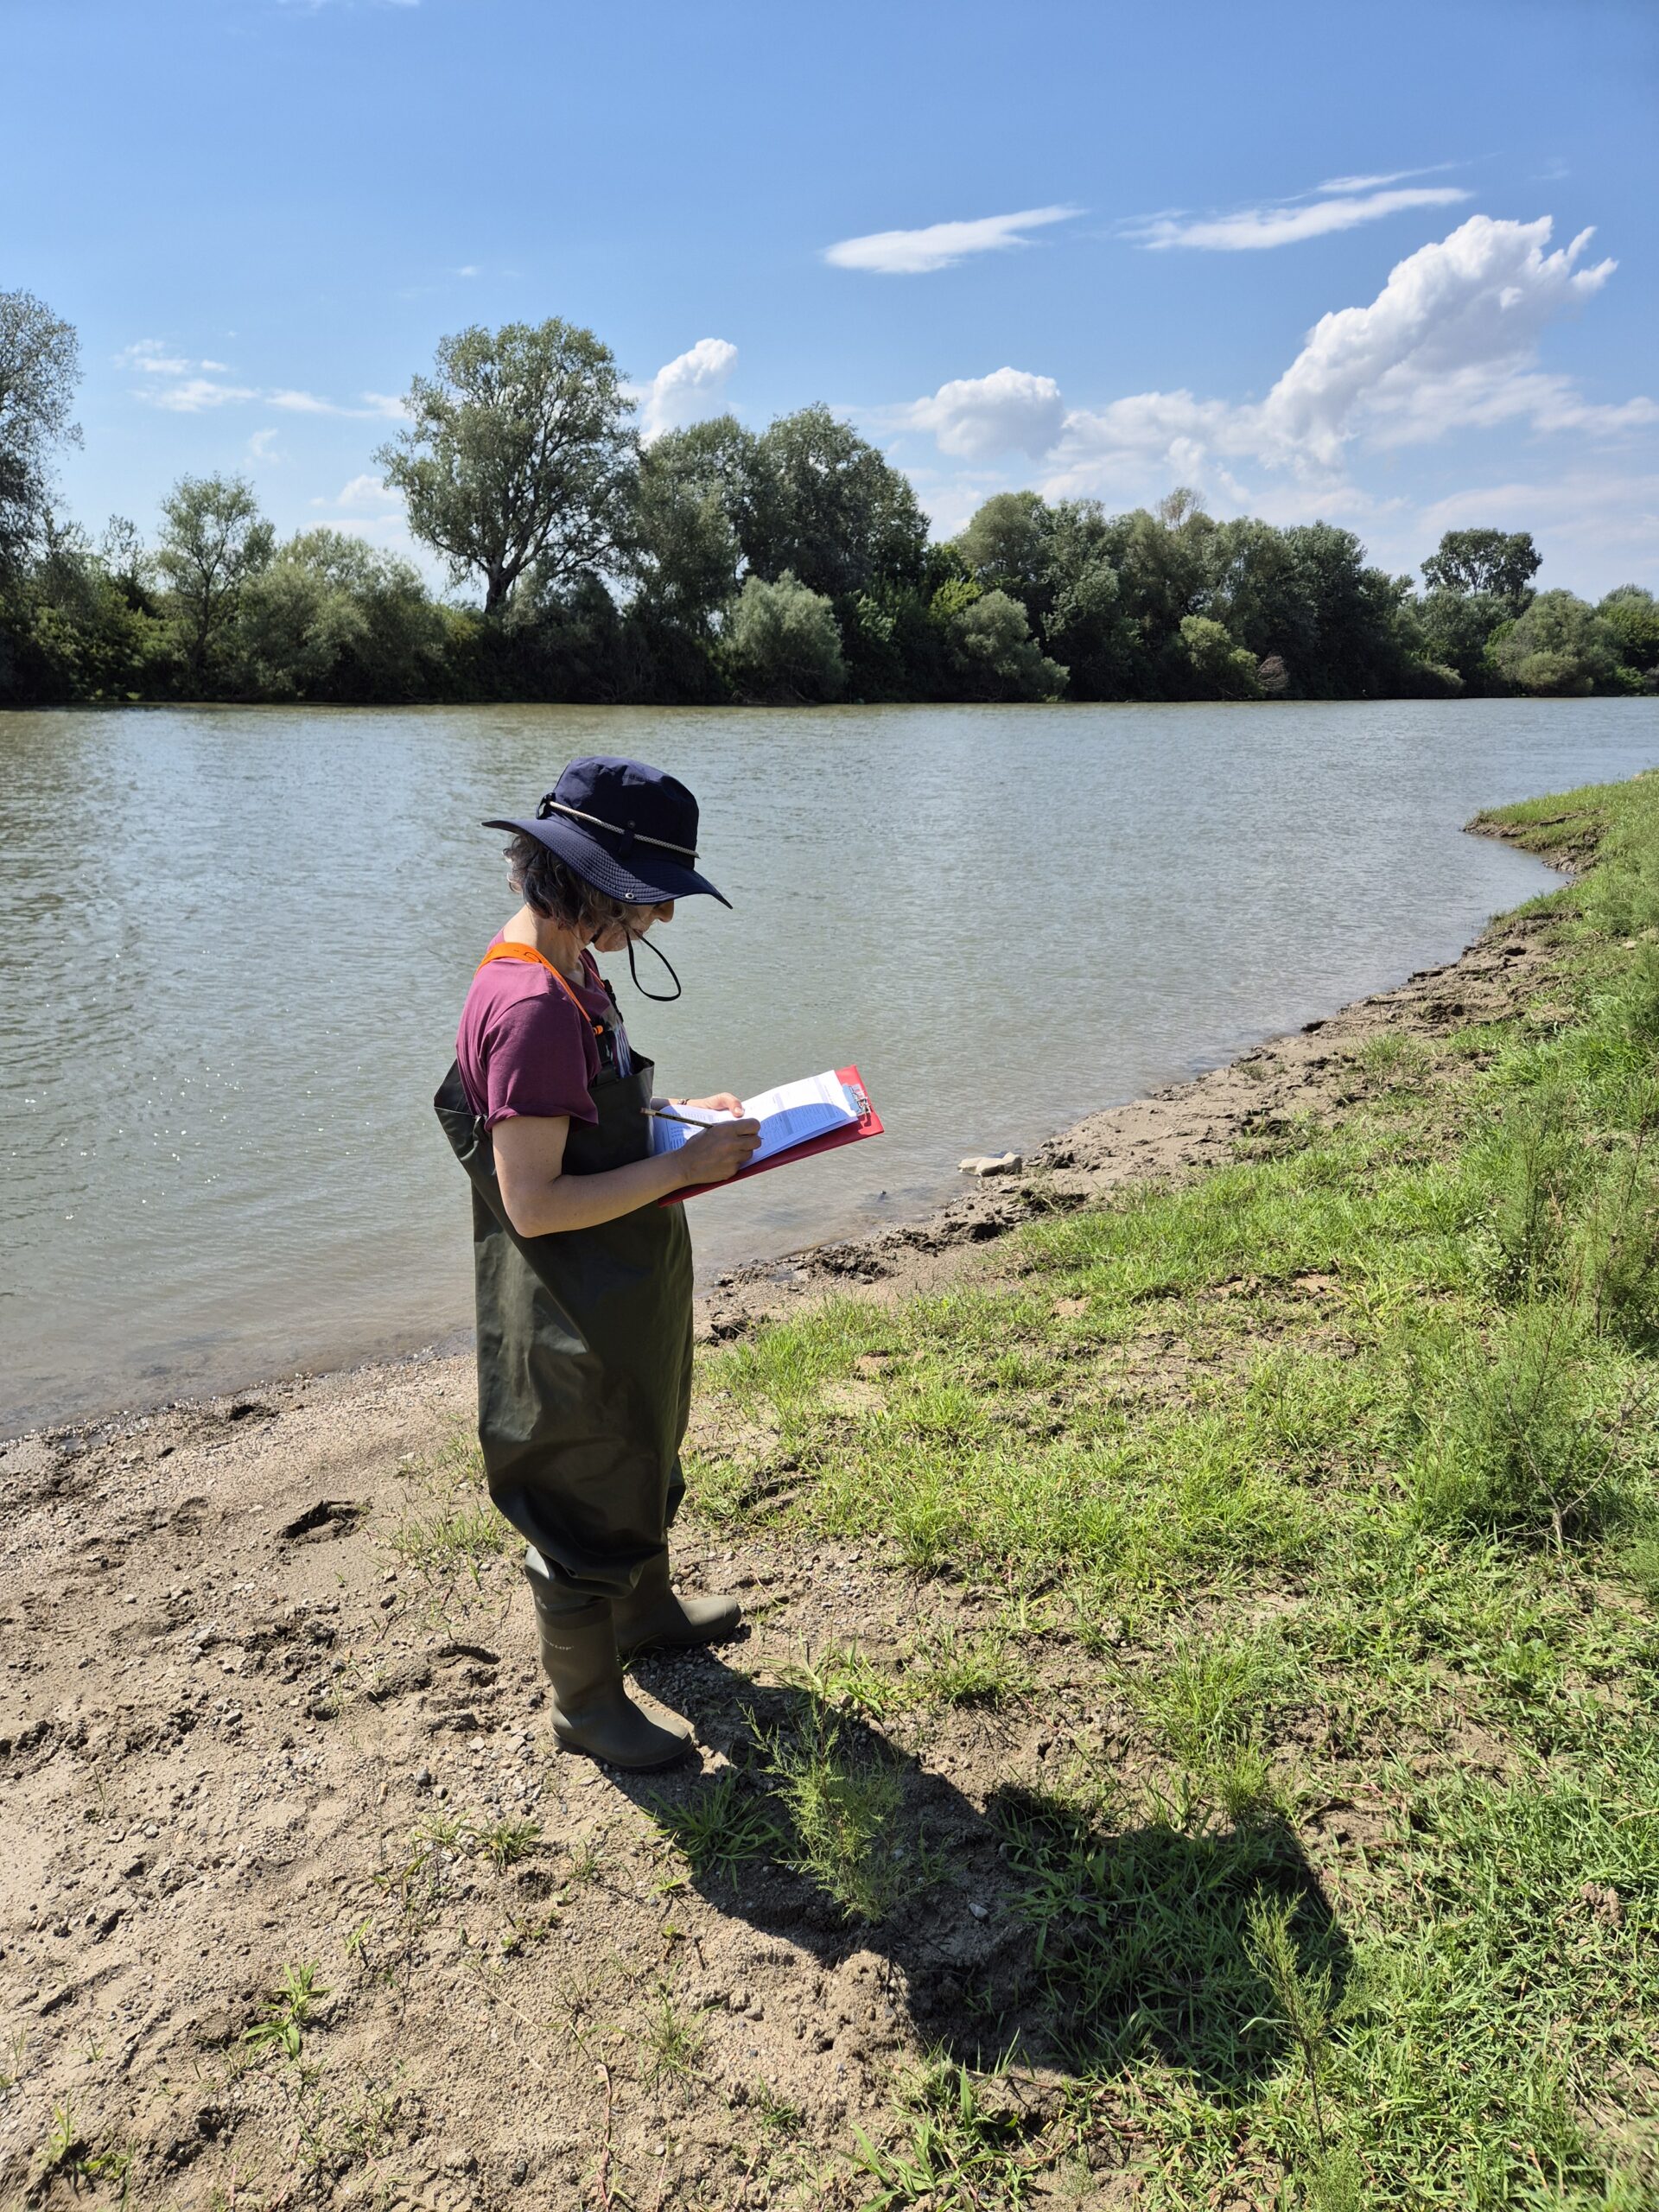
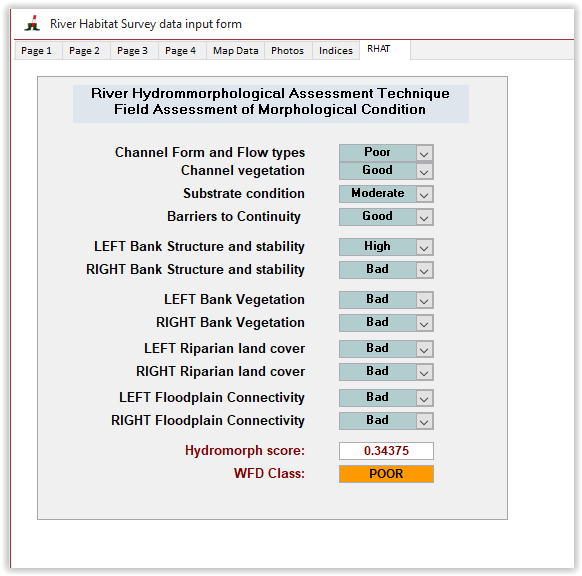
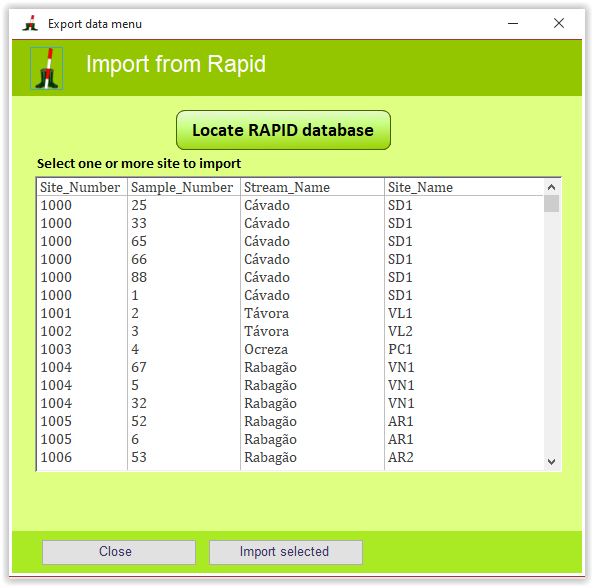
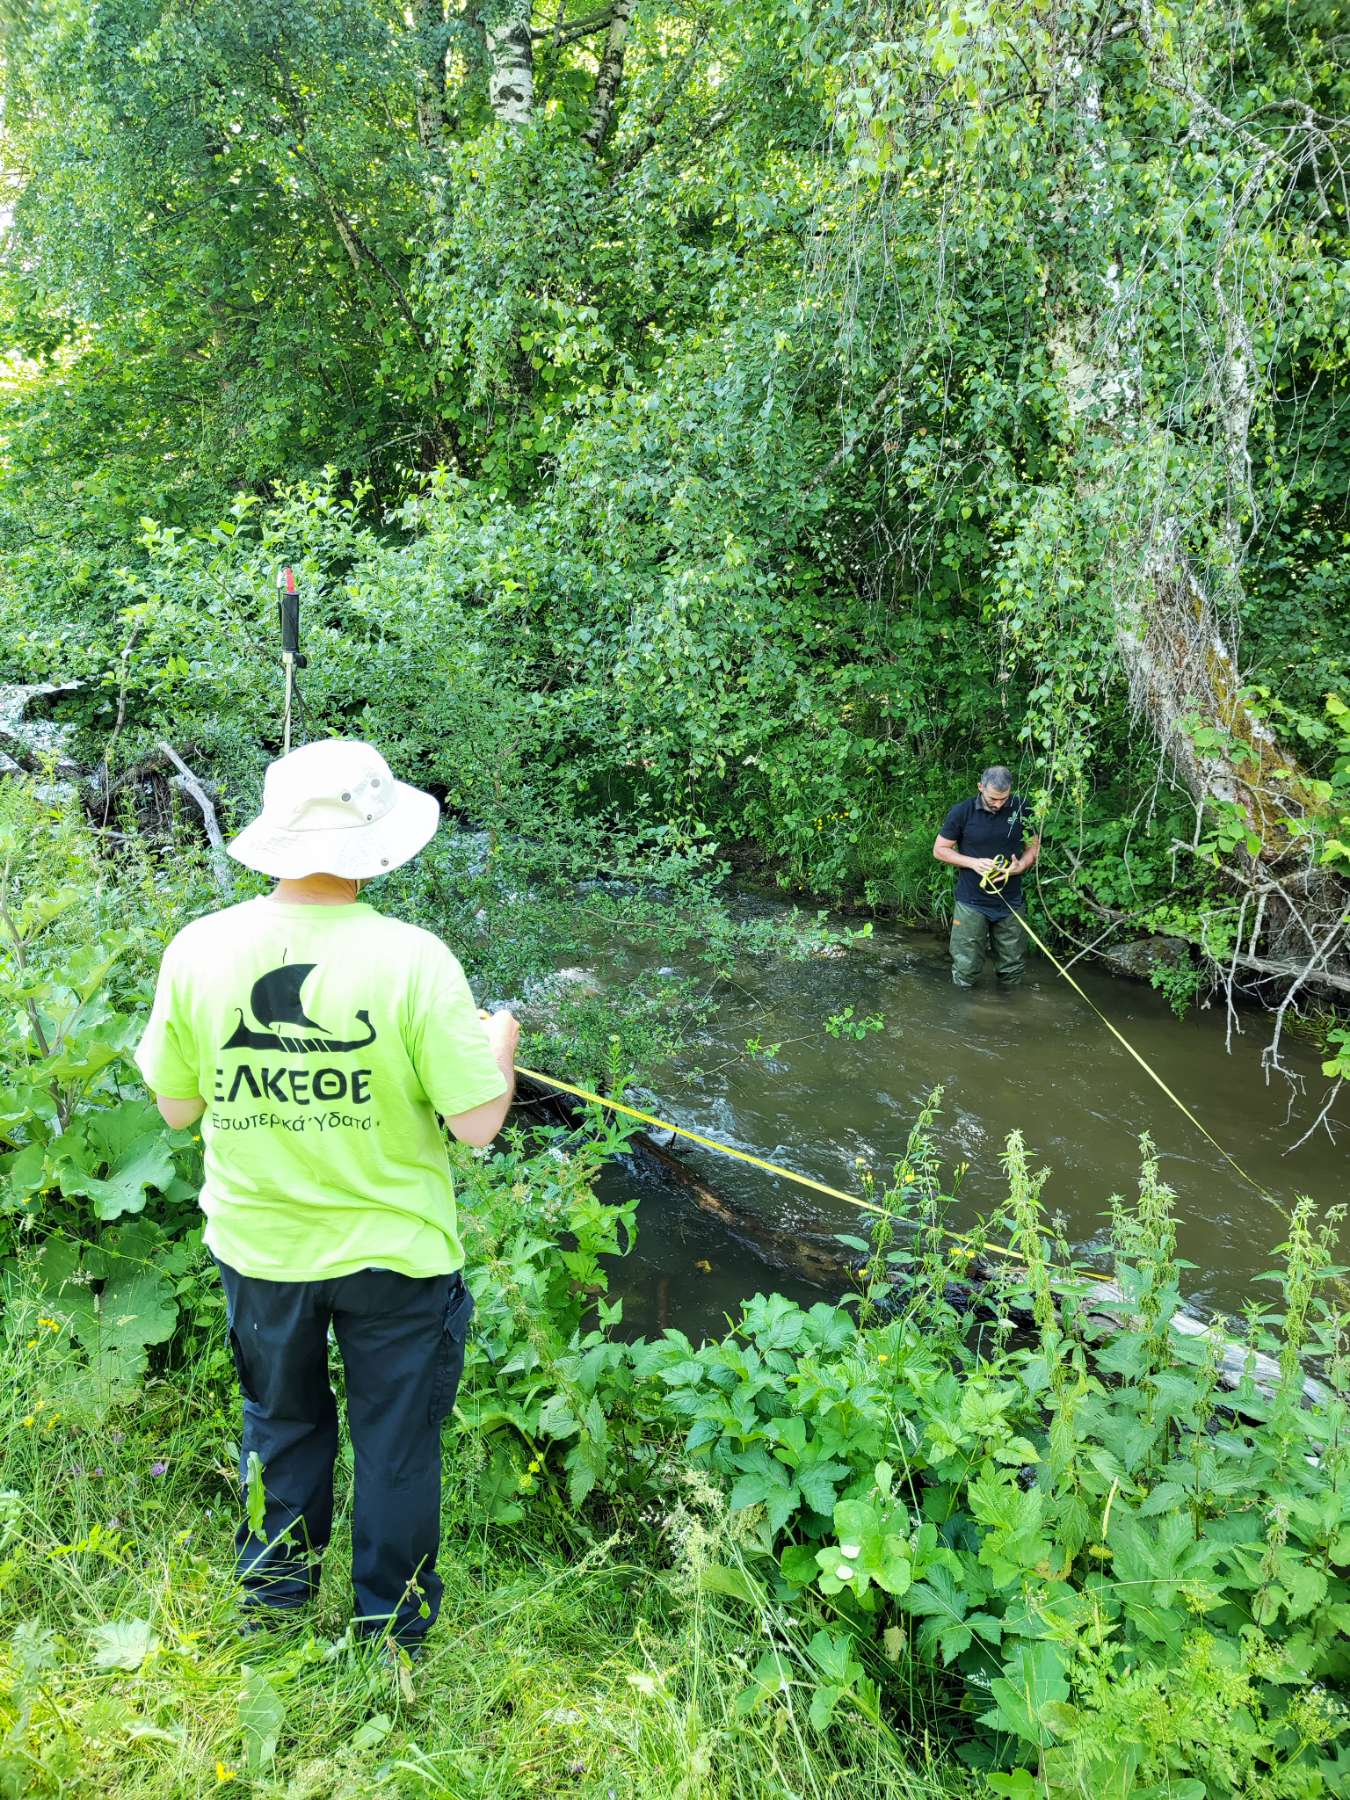
In response, our team from the Institute of Marine Biological Research and Inland Waters (IMBRIW), applied the River Habitat Survey in more than 300 river sites collecting information on a wide range of channel and bank features and recording various types of modifications and changes in the physical characteristics of rivers and streams. Although calculations of the Habitat Modification Score (HMS) were already feasible based on the existing information, Habitat Quality Assessments required a context analysis for comparing habitat features between sites of similar types.
In our recently published study, we integrated data from the Greek monitoring program into the RHS toolbox (version 2, not yet available) resulting to a new updated version that allows for type-specific assessments using the Habitat Quality Assessment (HQA) score. We specifically used data collected from 366 monitoring sites across Greece, representing a diverse range of river types and environmental conditions. This extensive dataset allowed for a comprehensive analysis of habitat quality across the country and for the first time since the implementation of the WFD in Greece, a classification of the hydromorphological quality of Greek rivers was achieved.
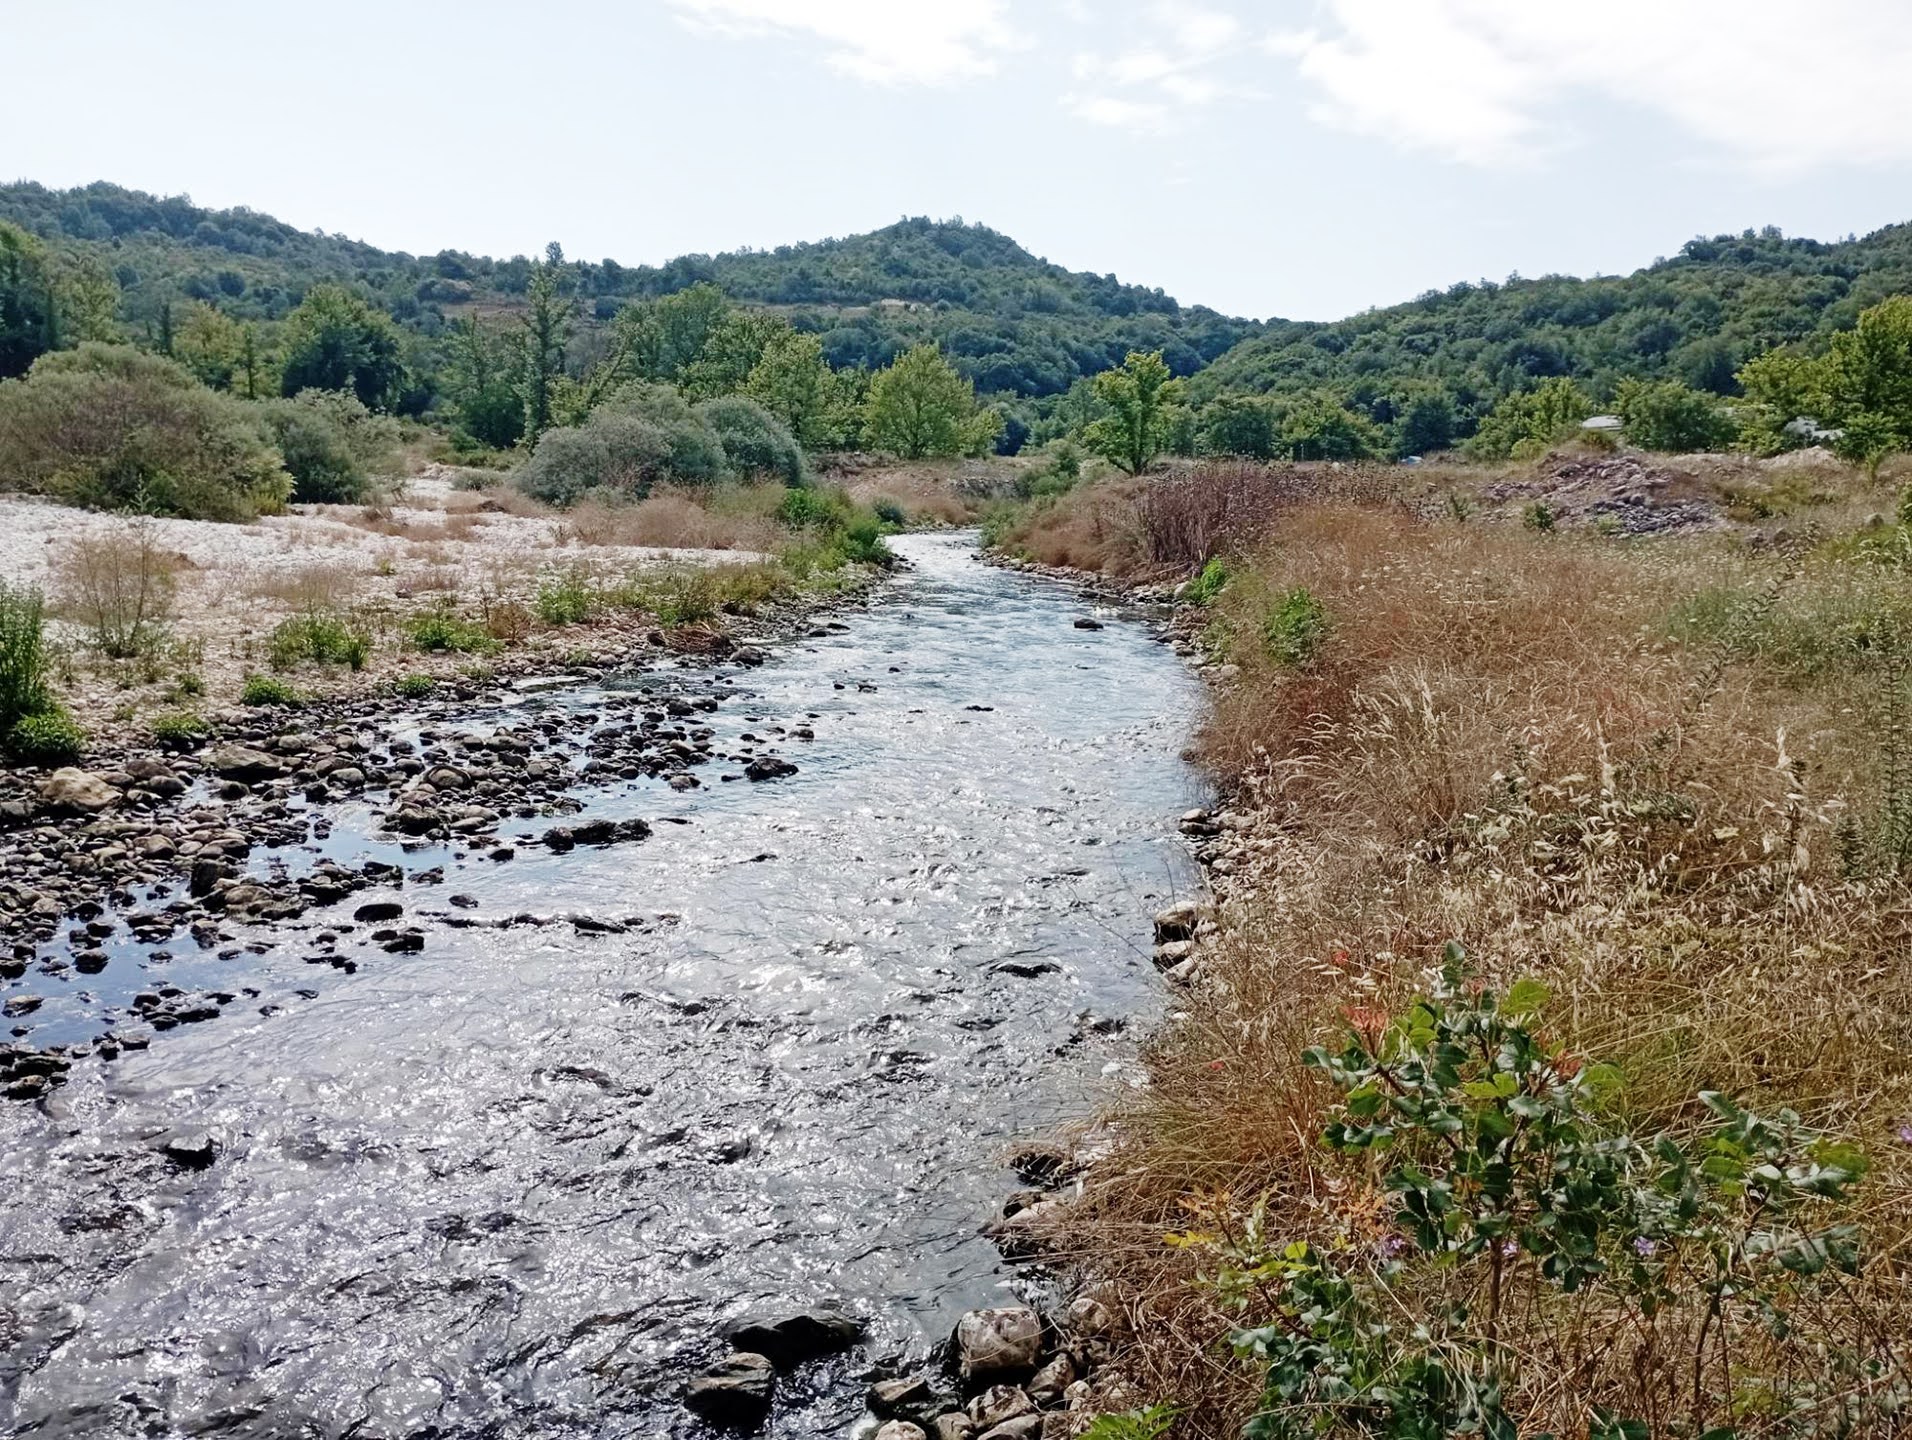
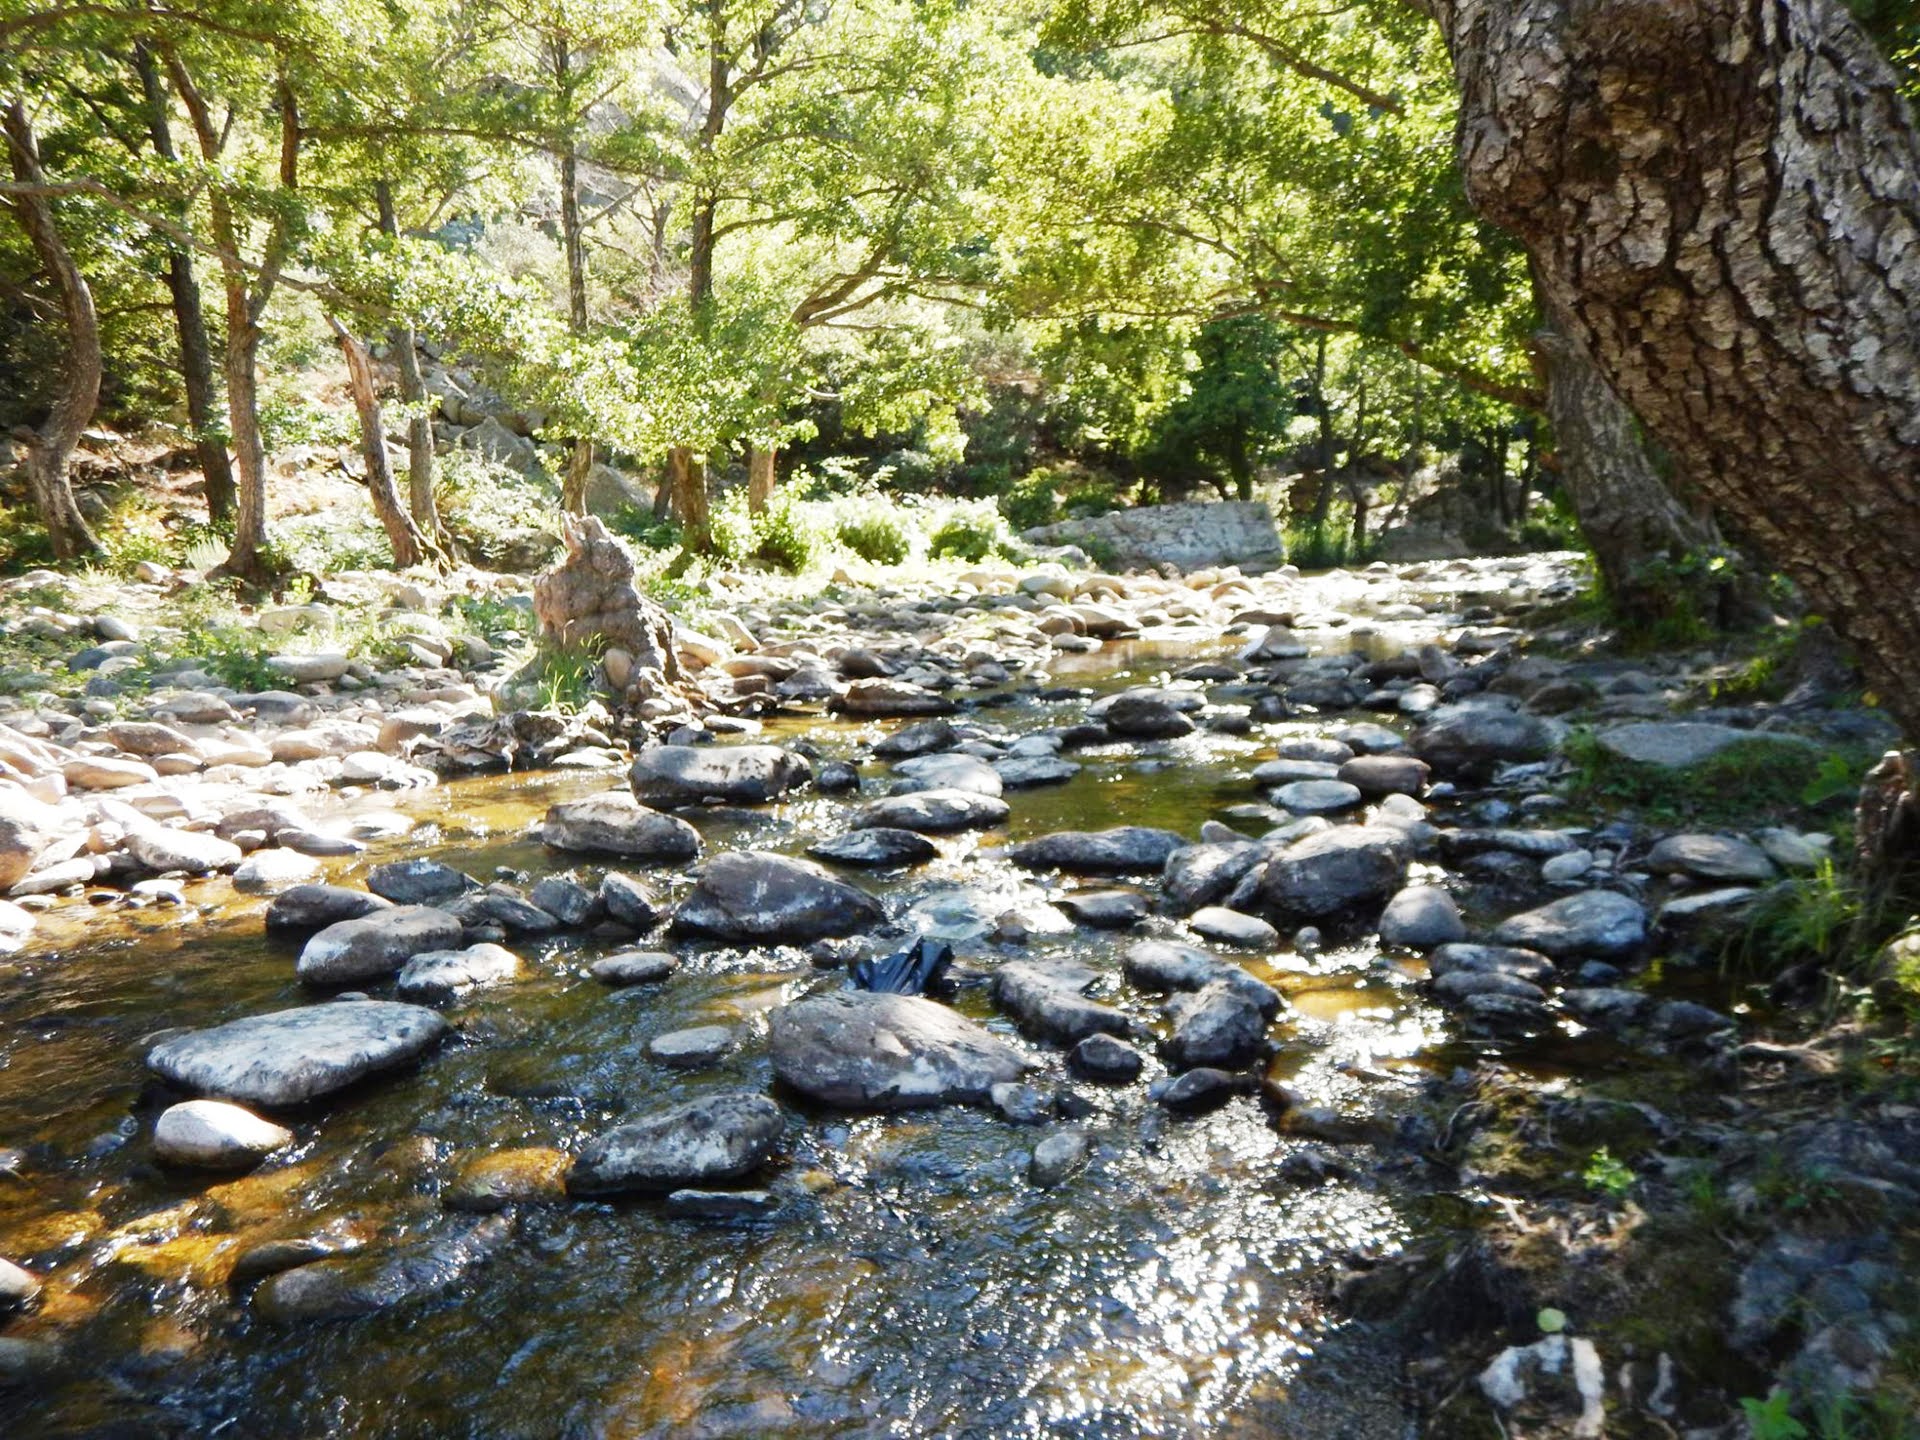
The findings of our study revealed significant spatial patterns in habitat quality, with variations linked to factors such as altitude, land cover, and regional differences. For instance, rivers in mid and high-altitude catchments with natural land cover generally had better HQA scores compared to lowland rivers surrounded by agricultural or urban landscapes. Specifically, rivers located in mid and high-altitude areas, especially those surrounded by forests or natural vegetation, displayed higher HQA scores. These areas are often less impacted by human activities, allowing for better-preserved river habitats. In contrast, lowland rivers, particularly those in agricultural regions, showed lower HQA scores. The intensive land use associated with agriculture often leads to increased sedimentation, nutrient runoff, and habitat degradation. Urbanized regions, such as the densely populated Attica district and parts of central Greece, exhibited lower habitat quality. The pressures of urban development, including pollution, altered flow regimes, and habitat fragmentation, were evident in these areas.
In addition to assessing physical habitat quality, we also explored the relationship between habitat quality and biological quality indices. We used the Ecological Quality Ratios (EQRs) for three biological quality elements: benthic diatoms, benthic macroinvertebrates, and fish. These elements are critical indicators of ecological health, as they respond sensitively to changes in water quality and habitat conditions.
Our results indicated significant correlations between HQA scores and EQR values, particularly for small and medium lowland streams. Sites with higher habitat quality tended to support healthier biological communities, emphasizing the importance of preserving and restoring physical habitat conditions to maintain ecological integrity.
The implications of our study for river management in Greece are profound. By providing a comprehensive assessment of habitat quality across the country, we have established a baseline for future monitoring efforts. The identification of regions and river types most at risk of degradation offers valuable guidance for targeted conservation and restoration initiatives.
Moreover, the study underscores the importance of integrating hydromorphological and biological assessments. The correlations between habitat quality and EQR values highlight the linkages between physical and biological aspects of river ecosystems. Effective river management must consider both elements to ensure the long-term health and sustainability of freshwater resources.
In conclusion, the study by the team of IMBRIW represents a milestone in the assessment of river habitats in Greece. By expanding the application of the RHS toolbox to a national scale, we demonstrated the value of a standardized, nationwide approach to habitat quality assessment, providing a model that can be adapted and expanded in the future.
However, the work is far from complete. Ongoing monitoring and research are essential to track changes in habitat quality over time, particularly in the face of increasing pressures from climate change, land use, and urbanization. The updated RHS toolbox, with its ability to provide detailed, site-specific assessments, will be an invaluable tool in this ongoing effort.
(1) Institute of Marine Biological Resources and Inland Waters, Hellenic Centre for Marine Research, Athens-Sounio Av., Anavissos 19013, Greece.
(2) to get access to the full paper, use this link: Expanding the habitat quality assessment of rivers in Greece using an updated River Habitat Survey toolbox. Ecology and Hydrobiology (2024-07-25)